L&TD
LOGGING & TESTING DIVISION
Data Processing and Interpretation
Processing & Interpretation services
Processing and interpretation for openhole log data
- Processing and interpretation for sedimentary formation
- Processing and interpretation for basement rock
- Processing and interpretation for EMI,CAST-V, FULLWAVE/WAVESONIC data
Processing and interpretation for casedhole log data
- Processing and interpretation for PLT data
- Cement bond evaluation
- Casing and tubing inspection
- Processing and interpretation for well testing data
Others
- Determine the well bottom
- Determine the stuck point
- Determine the perforation intervals
- Determine the level of fluid/cement
- Recommend the perforation intervals
Data storage
Personnel 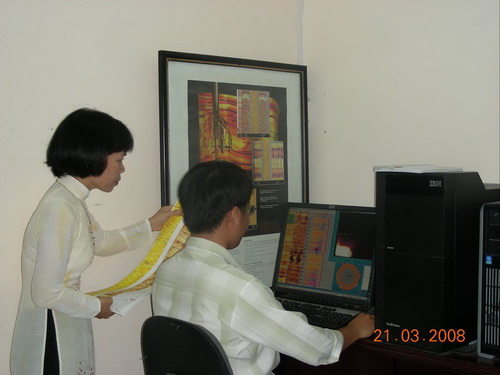
The Processing Interpretation Center has an international staff, including Petrophysicists,Geophysicists,Geologists,IT engineer and technicians. Engineers were graduated for the long term in well-known Universities Institutes in USSR and Vietnam and highly trained in specific subjects in USA, UK, Russian, etc.
All Processing & Interpretation Center’s engineers are trained in intensive training courses with particular regard to process and interpret logging data.
Most of them have more than 10 years working experiences.
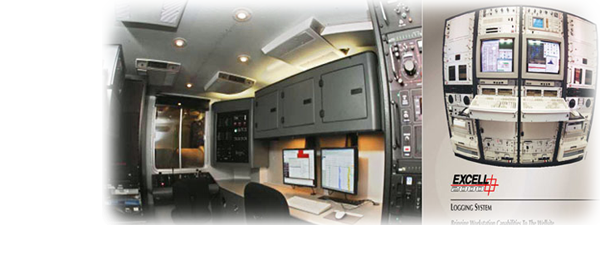
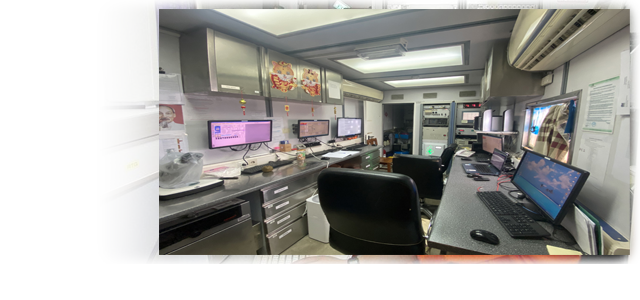
Hardware
- Workstation system (UNIX OS) from Halliburton
- IBM-RS/6000 servers
- Specialized printers, terminals & PCs … connected to servers.
- Petrosite complex (Windows OS) from Halliburton - Powerfull PC with processing software.
- LAN for internal working
Software
General information
The Processing & Interpretation Center have used the software of the well-known firms as: Halliburton (DPP, PETROSITE…), Schlumberger (IP), Huanding (Forward.net) Kappa (EMERAUDE, SAPHIR,…), ALT (WellCARD,…), Sondex (Warrior, MITCal, MITView, MITPro,…), Russia (LogPWIN) and the software of Vietsovpetro ( BASROC, 3DView,…). The staffs are graduated with high competence and experience in their professionals.
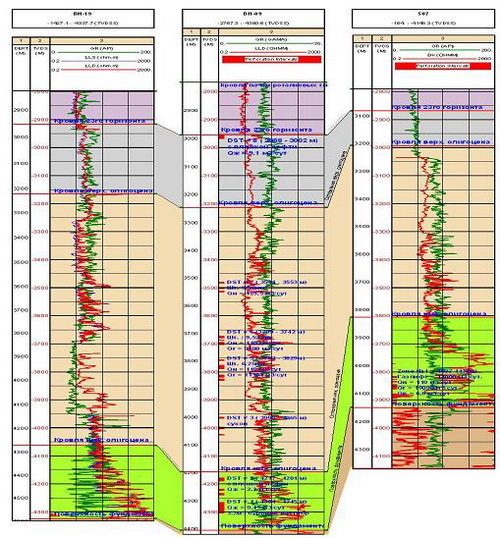
1. Openhole Data
- Processing and Interpretation for sedimentary formation (IP, SASHA, CORAL, ULTRA software)
- Processing and Interpretation for basement rock (BASROC software)
- Processing and Interpretation for FULLWAVE/WAVESONIC data (FULLWAVE software)
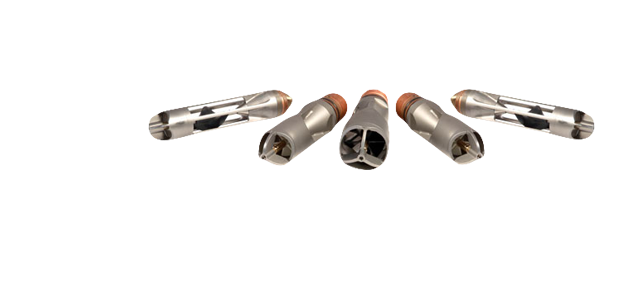
- Processing and Interpretation for Image Log - EMI,CAST-V data (IMAGER software)
- Forward.net software …
IP software
Interactive Petrophysics is a portable PC-based software application for reservoir property analysis and summation. From simple workflows such as quality checking log data to performing complex tasks of multi-zone, multi-well petrophysical analyses, Interactive Petrophysics is ideal for both petrophysicists and geologists.
Sasha software
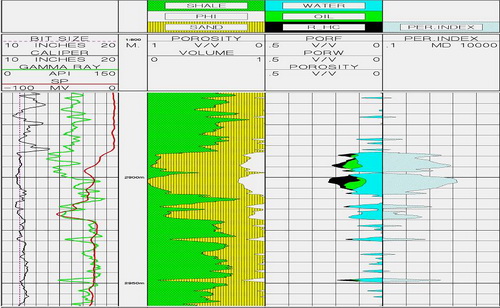
The SASHA program evaluates shaly sand reservoirs, and provides effective porosity, water saturation, clay and silt volumes. Sasha analysis can also determine the relative permeabilities. This is an industry standard shaly-sand analysis model.
CORAL software
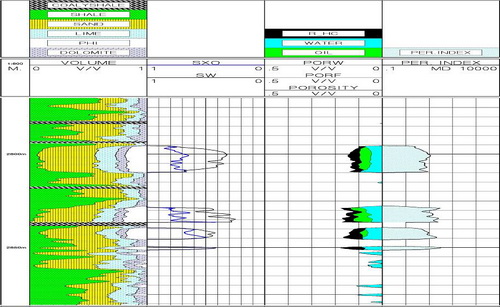
CORAL Analysis provides an accurate detailed description of reservoirs and mixed lithology. Its primary use is in the evaluation of formations, which contain shale, sand, limestone, dolomite, anhydrite, and gypsum. The software will provide determination of shale content, cross plot lithology (sandstone-limestone or limestone-dolomite), anhydrite content, porosity, secondary porosity or gypsum (if an acoustic log is available), permeability and water saturation.
Ultra software
ULTRA is one of the most famous software in petrophysical analysis. This program is a set of software modules, designed to process wireline logs. ULTRA program is based on an optimization approach, computing the most probable parameters from the set of logs and local knowledge of the logging environment. The following Log Analysis Models are built in: Shaly Sand, Sand-Lime-Dolomite with up to six other minerals and clay, Igneous and metamorphic reservoir model.
Basroc software
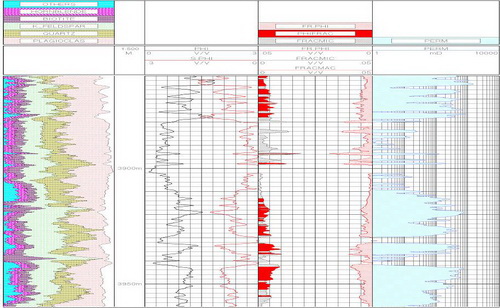
Reservoir model – two porosities and two permeabilities: Macrofracture zones characterized by macro-fracture systems, distributed directionally with hydrodynamic permeability. Microfracture zones distributed along surfaces of macrofractures
BASROC is an advanced multi-mineral log analysis program for basement rock. It computes the most probable formation mineralogy and total porosity, open porosity using a multi-log, least-squares inversion technique. It is particularly valuable in areas of mixed lithologies, special minerals and two porosities systems. Grade porosity by filtered method. Calculate fracture porosity by looped technique.
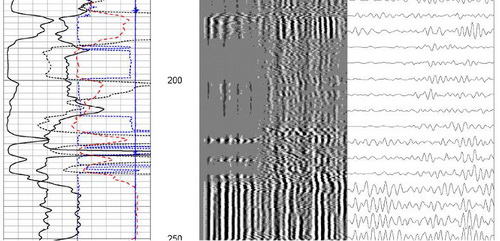
Fullwave software
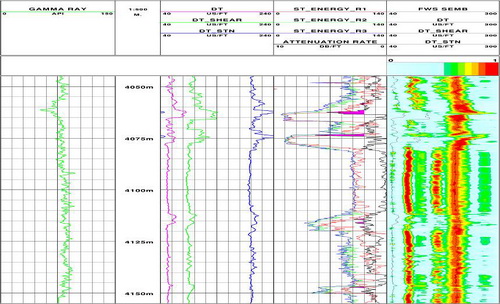
FullWave software is a waveform diagnostic program. It can be used to display waveform data in time and frequency, perform frequency filtering, and for estimation compressional, shear, stoneley slowness using semblance processing from wave acoustic processing program and attenuation of Stoneley wave energy.
Beside that, FullWave module allows for Anisotropy Analysis
- Simultaneous Solution of the in-line and cross-line waveform data using an inversion technique
- Determine Fast and Slow Shear Wave Travel Times
- Determine the Orientation of the Fast Shear Wave
- Determine the Waveform Energy Associated With the Anisotropy for the In-line Receiver Array and the Cross-line Receiver Array
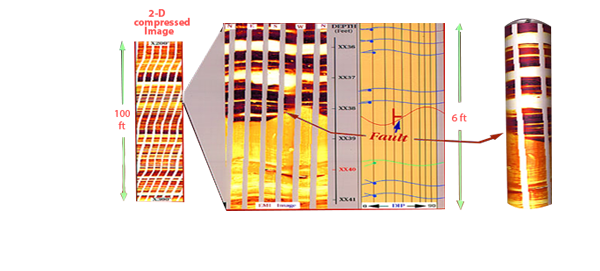
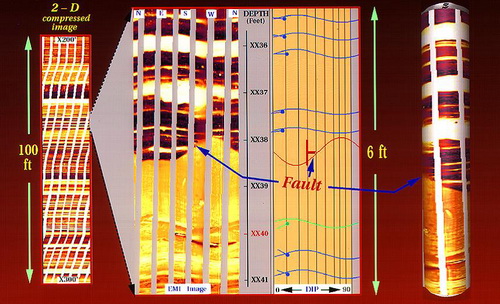
Imager software
IMAGER is an interactive image interpretation software package used to present and analyze vector data from the Circumferential Acoustic Scanning Tool (CAST), Electric Micro Imaging (EMI) tool, Six arm Dipmeter. Imager allows displaying the logged data graphically in various ways. The images may be enhanced to emphasize certain features, facilitating the interactive dip calculations of planar feature, fracture identification & orientation and borehole breakout mapping.
- Displays dipping beds or fractures in polar coordinates.
- Useful method that condenses results into a concise form.
- Good for establishing dip averages.
- Good for determining structural dip
EMI Results
- Displays dipping beds or fractures in polar coordinates.
- Useful method that condenses results into a concise form.
- Good for establishing dip averages.
- Good for determining structural dip
2. Casedhole Data
Processing and interpretation for PL data
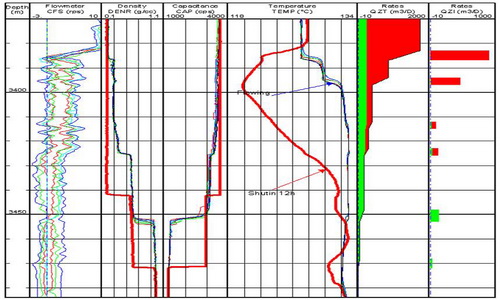
EMERAUDE SOFTWARE
- Production logging surveillance has given the reservoir engineer a powerful tool in the drive for refined reservoir characterization. Emeraude is now used by all the major service companies, many independent operators and service providers. Emeraude is seen as the industry standard allowing a common platform for communication and interpretation between service companies and operators.
- From vertical injectors to horizontal or highly deviated multiphase producers, Emeraude provides a comprehensive and intuitive set of tools, to produce results from the log data from simple through to the most sophisticated tool strings. KAPPA remains committed to the ongoing development of the industry standard PL interpretation package by remaining in close contact with tool manufacturers.
- Emeraude offers a full range of flow models from single to 3- phase flow. Specific models are provided to handle flow re- circulation as well as flow through standing water columns.
- Rate calculation is treated as a minimization problem and solved using nonlinear regression, offering full flexibility in the type and number of input measurements. Interpretations can be run from any number of sufficient inputs including: spinner apparent velocity, density, pressure gradient, capacitance, holdup of any phase, velocity of any phase, rate of any phase, and temperature. Recent additions permit multiple measurement of the same type.
Cement bond evaluation
The basic reasons for casing a well are to provide wellbore stability, zonal isolation and control of well fluids. Cement provides mechanical support for the casing and the isolation seal between the casing and the formation. Without effective isolation there is a risk of communication between zones, water infiltration and leakage to the surface.
The L&TD’s available measurements from 4AK-1T, Sector Bond, BCDT and CAST-V tools are used for cement bond evaluation.
Casing and Tubing inspection
The productive life of an oil well can be reduced by the condition of the well itself. Deterioration of the casing or tubing can be caused by corrosion, unintentional damage during drilling and intervention or formation movement. Scale build-up can also reduce production. Remedial work can be minimized with exact knowledge of a well's condition. The operator can receive early warning of a potential problem and obtain data for determining a specific restoration program by running the casing inspection suite.
The L&TD’s available measurements from Max-Min or Multifinger Calipers and CAST-V tools determine the condition of the casing or tubing within a well.
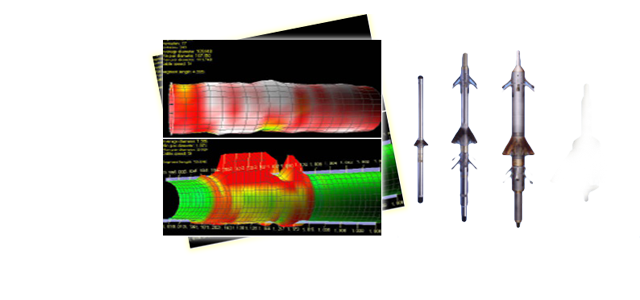
MITView software
- One of the most effective ways of understanding the condition of a well is to produce 3D images. To achieve this, we use a package called MITview.
- This powerful presentation package uses the ASCII files of data recorded by an MIT to produce 3D images on a PC screen.
- While views down the well are very informative, MITview can be used to allow the operator to look at features from different directions. Full control of the displayed image allows it to be angled, rotated, lengthened etc.
MITPro software
MITpro software is used to process raw data from the Multifinger Imaging Tool (MIT). The MIT is used to detect changes of the internal diameter of tubing or casing; tool data is normally output as a log curve for each finger, which can be a significant amount of data to evaluate manually. The MITpro program has been developed as an aid for data processing and analysis.
Tool data is read by the MITPro software to determine the metal loss, scale build-up or damage in a completed well. Collars can be automatically detected, then the data for each joint of casing or tubing is processed and the percentage change of internal diameter from nominal is calculated. The analysis overview lists all potentially damaged pipe joints and a picture representing the pipe cross-section for each one can be generated to show the internal diameter change from nominal.
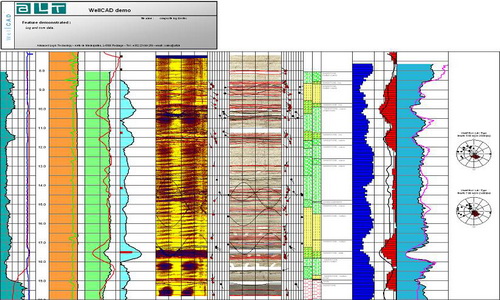
Well card software
- WellCAD is PC based composite log package, which combines comprehensive graphic editing mechanisms and data processing tools.
- Combining technically excellent display, editing and analysis capabilities for well data, WellCAD has become the standard log composite software in the Mining, Oil&Gas and Geotechnical society and is used in a wide range of applications. The basic module incorporates all features and tools necessary to import, edit, process and display Well data. The software is delivered with a set Templates, Header, Dictionaries customized for specific application. You can of course easily modify existing ones or create you own.
- WellCAD handles a wide range of data type from wire line data, core data, images, comments and many more. All data are numerical and can be edited in a separate spread sheet view (tabular editor)
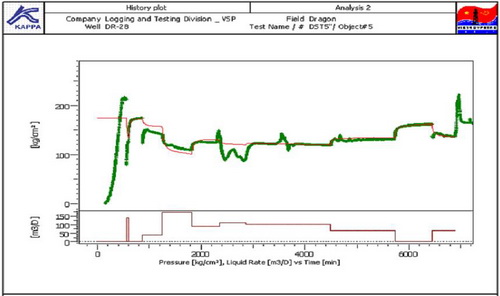
3. DST Data
Saphir software
Well testing service was formed since 1984 and has been successfully tested hundreds of objects in the White Tiger, Dragon, Big Bear field , Soi and Hoang Long objects on Vietnam offshore, etc.
Saphir softwave has been used in L&TD since 2000. This is one of the best testing interpretation software. This software can estimate reservoir parameters as Pi - initial pressure, K - permeability, C - well bore storage, S - skin, R - effect radius, K.h – permeability-thickness product, etc. with high accuracy and reliability. It can interpret testing data in oil, gas, water well with different geological models.
4. Storage data
Logging data are stored secure in data base and paper documents in a store. It convenient for users upload or download data from data base and easy to find documents in the store.
Data are saved in to DVD every 3 months
Clients
The PIC has performed processing and interpretation for oil companies operating in Vietnam:
- Vietsovpetro: All products of PIC.
- VRJ: All products of PIC.
- JVPC: PLT, Casing inspection.
- KNOC: PLT, Real-time Petrophysics
- CONSON: Basrock Processing.
- …
Nhóm Marketing