L&TD
LOGGING & TESTING DIVISION
MITPro SOFTWARE
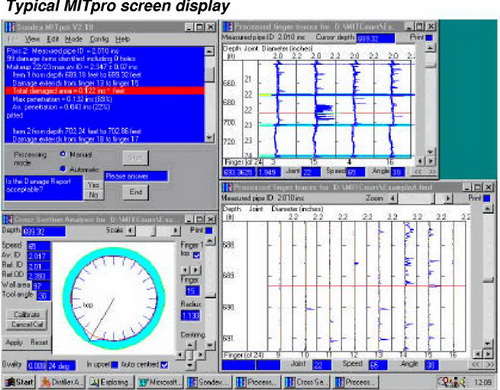 |
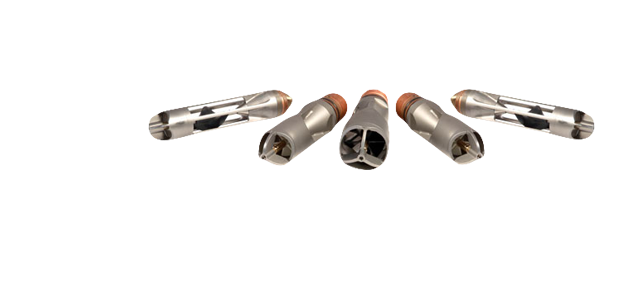
MITPro SOFTWARE DESCRIPTION The Data Processing Software for the Sondex Multi-Finger Imaging Tool (MITpro software) performs the task of processing MIT raw data automatically, but under interactive user control. It reduces the tedium of manually analysing the data, producing consistent, reliable reports showing where and to what degree the pipe wall is damaged or scaled. The software locates |
|
collars in tubing or casing, using a range of specialised, automatic search algorithms. The results can be modified interactively, until a suitable description of every joint is obtained. To process the data, the software uses algorithms, which correct for tool decentring and fit the interior shape of the pipe locally. All deviations from the fitted shape are merged and classified into damage reports. The software configuration can be adapted to process the data from any type of survey, using any Sondex MIT tool. MITpro can generate highly reliable and consistent survey reports, which are stored as |
|
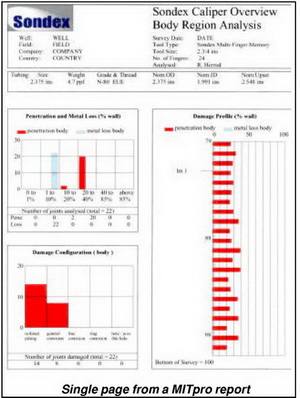
ASCII format disc files. These include Summary Report Files, which summarise the findings as a Joint Tabulation, and Process Report Files, which contain detailed damage information. The Summary Report can be printed out, to a high presentation standard, suitable for offering to end-users directly. Worst-case cross section plots can be generated and appended to the report automatically. Both metric and imperial formats are supported throughout. The MITpro software is a 32-bit application, which runs under Microsoft Windows 95 or Windows 98. The software can also run under Windows NT.
|
 |
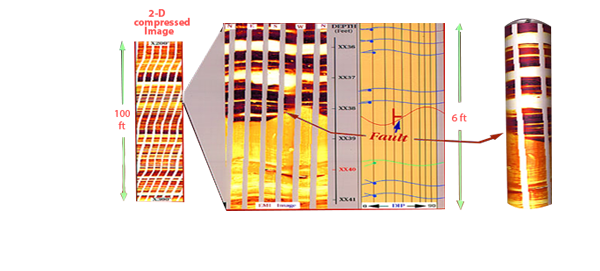
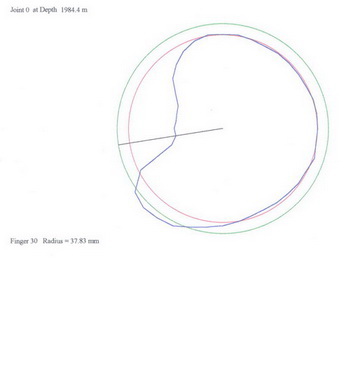
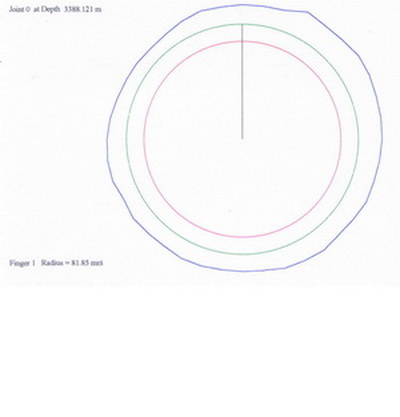
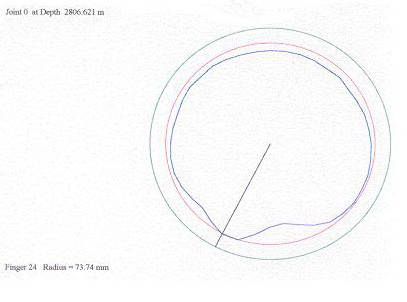
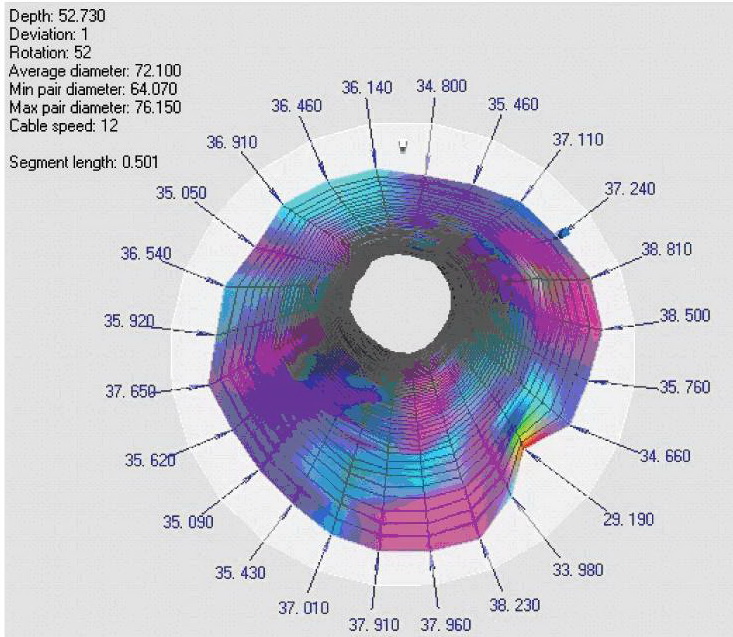
| Cross-sections produced by MITPro are very important to know the real status of the pipe in the well. MITPro has therefore been widely used in casing and tubing inspections in L & TD – VSP. These cross-sections combine with plots, produced by WellCAD and MITView software and are the most effective ways of showing pipe status.
Some pictures below were taken from the casing and tubing inspection results. Data source was recorded by MIT (24,40,60) tools in White Tiger oil field. |
 |
|
|
 |
 |
|
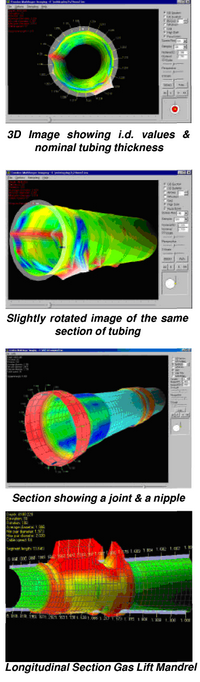 |
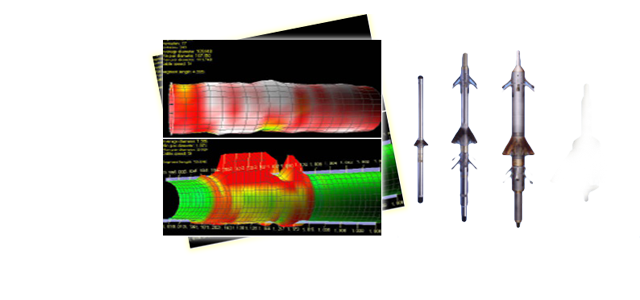
MITView SOFTWARE DESCRIPTION One of the most effective ways of understanding the condition of a well is to produce 3D images. To achieve this, we use a package called MITview.
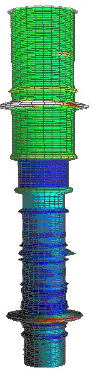 s of a particular job together with an operating version of the program. This allows the engineer responsible for the well to run MITView and examine the data himself s of a particular job together with an operating version of the program. This allows the engineer responsible for the well to run MITView and examine the data himselfExported images can be used to produce hard copy pictures suitable for use in written reports, for example the BOP shown on the right. |
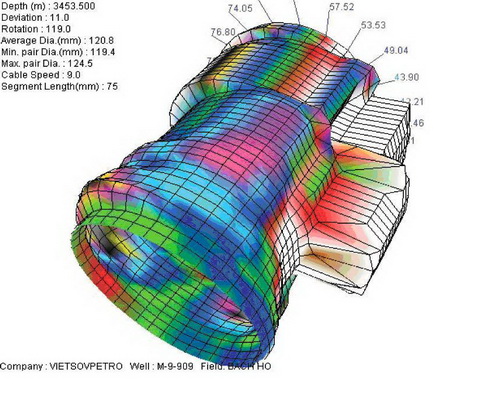
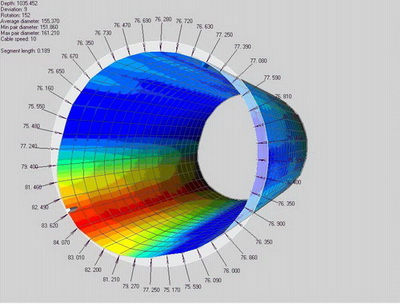
| Some pictures below illustrate this software application in Vietsovpetro L&TD. Data was recorded by MIT (24,40,60) tools in White Tiger oil field. |
 |
|
|
 |
 |
|
Nhóm Marketing