L&TD
LOGGING & TESTING DIVISION

Emeraude
|
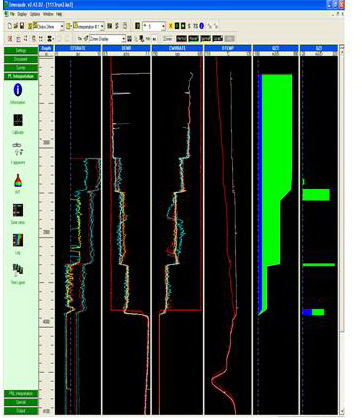
Emeraude has been uesd in Vietsovpetro L&TD since 2000.
This is one of the best production log interpretation softwares, an impossibly missing tool of reservoir monitoring.
In recent years production logging has moved from being considered as the tool of last resort to a powerful quantitative method that takes its own place in the set of data acquisition tools for the reservoir engineer.
This has been due to two factors: the lowering of acquisition costs using 'fit‑for‑purpose' tools and shifting the interpretation into the hands of the end‑user engineer by the development of client as opposed to tool focused software; Emeraude. In the past, PL was a highly specialized business. Data acquisition was made using expensive tools and interpretations were performed by engineers poring focused on the mechanical aspects of the tools and looking for specific well problems but not on the reservoir under study.
The realization of the value of the results of a production logging surveillance survey has given the reservoir engineer a powerful new tool in the drive for the more accurate and refined reservoir characterization.
All the major and most of the independent service companies as well as many operating companies now use Emeraude. Emeraude is seen as the industry standard allowing a common platform for communication and interpretation between service companies and the operators.
The latest version of Emeraude, Version 2.42, includes facilities for the interpretation of highly deviated to horizontal wells with specific processing for multiple‑probe tools. These include the generation of holdup/bubble images and the display of holdups inside a representation of the wellbore.
KAPPA remains committed to the ongoing development of the industry standard PL interpretation package, Emeraude. |
| METHODOLOGY
Reference channels / Spinner calibration An interpretation starts with the selection/definition of a Reference Channel for each available measurement. From the spinner passes ‑ if a spinner has been run ‑ the in‑situ calibration can be calculated on user selected calibration zones and a resulting apparent velocity channel is generated. PVT The fluid type is defined, and the PVT properties of each phase are represented using a wide variety of Black‑Oil correlations, for bubble point or dew point fluids. Each correlation can be matched to a set of user entered constraint points, to ensure that the model values are representative. |
 |
|
Zone Rates When all the required information has been entered, the user defines a number of calculation zones, outside the assumed inflow zones. Based on the fluid types and the available measurements Emeraude suggest a list of possible flow models and, for the one retained by the user, the software automatically calculates the cumulative phase rates on all the calculation zones. The rates are obtained using non‑linear regression, which makes it possible to supply any relevant set of inputs, and to possibly use redundant information. The solution rates are found by minimizing the error between measured and simulated values. Each difference (or residual) can be weighted separately. The following measurements are viable regression inputs: density, spinner apparent velocity, holdup of any phase, velocity of any phase, rate of any phase, mixture rate, mixture velocity, and temperature. The measurements may be continuous or stationary. The simulation is based on a full range of flow models from single‑phase to full 3‑phase situations, and a number of slippage correlations for those cases, in vertical or deviated wells. Specific models are also provided to handle flow re‑circulation (apparent down flow) as well as flow through a standing water/liquid column. In the Zone Rates option, the backbone of the interpretation, all the results relevant to the calculation on any particular zone can be visualized such as the flow regime, the slippage velocities, holdups, the flow map for the selected correlation, etc. The model / correlations can be modified, the velocities can be changed manually, and the surface conditions can be matched. etc. The solution can be examined in terms of actual contributions (rather than cumulative). Global Regression, solving simultaneously for all the contributions on the entire well, can be run if necessary. The Global regression can be used as a second path to impose constraints on the solution. Constraints can be individual sign constraints (producing zone or a thief zone). Contributions can be manually edited and/or fixed to a given value. This helps finding a coherent solution when standard methods fail. |
Nhóm Marketing


