L&TD
LOGGING & TESTING DIVISION

MITView SOFTWARE
 |
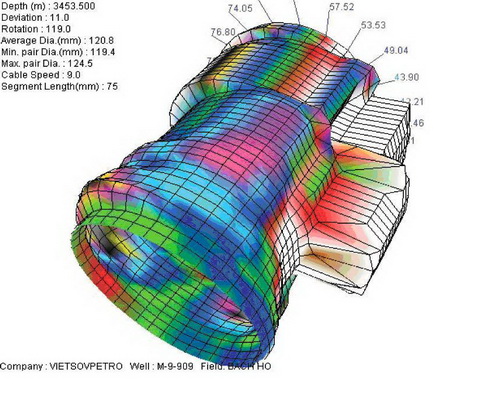
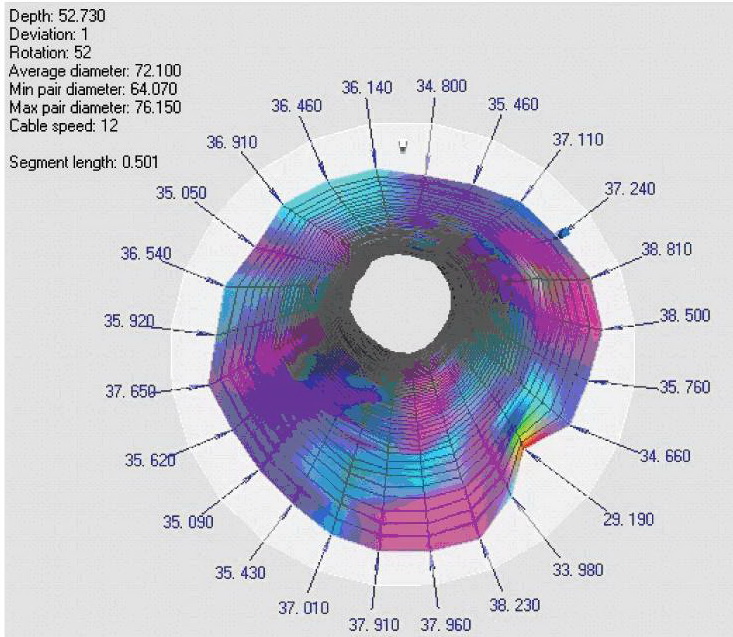
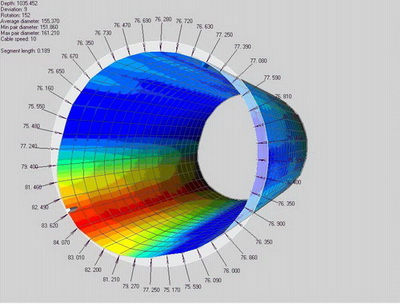
DESCRIPTION One of the most effective ways of understanding the condition of a well is to produce 3D images. To achieve this, we use a package called MITview
 s of a particular job together with an operating version of the program. This allows the engineer responsible for the well to run MITView and examine the data himself s of a particular job together with an operating version of the program. This allows the engineer responsible for the well to run MITView and examine the data himselfExported images can be used to produce hard copy pictures suitable for use in written reports, for example the BOP shown on the right. |
| Some pictures below illustrate this software application in Vietsovpetro L&TD. Data was recorded by MIT (24,40,60) tools in White Tiger oil field. |
 |
|
|
 |
 |
|
Nhóm Marketing


