L&TD
LOGGING & TESTING DIVISION
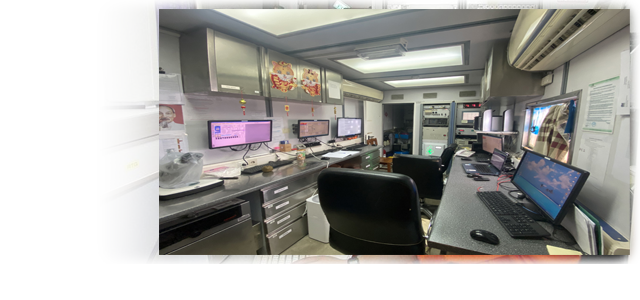
Data Processing and Interpretation
WellCAD SOFTWARE
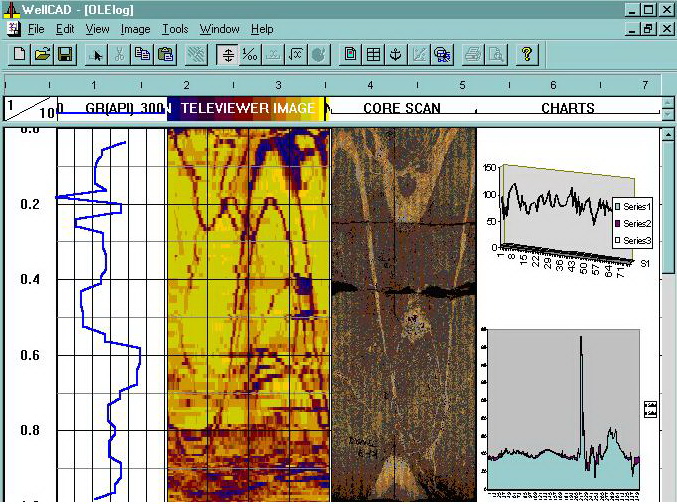
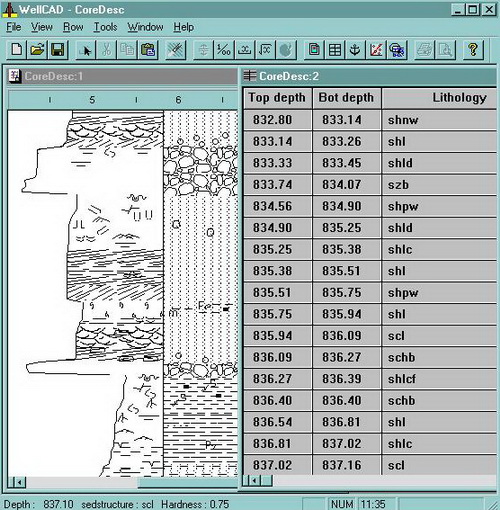
| WellCAD is one of the most powerful and interactive PC based well data management tools available on the open market.
WellCAD is a single well-oriented system that operates under Win32, the 32 bits application-programming interface (API) from Microsoft.
WellCAD runs on Windows 3.1x, Windows 95, Windows NT and DEC Alpha AXP running Windows NT. WellCAD is OLE2 compliant and supports OLE object linking and embedding, OLE automation and drag and drop between WellCAD documents and other OLE compliant software. |
|
Windows compatibility Compatibility with Windows means that WellCAD printing and plotting is virtually hardware independent. Data exchange between WellCAD and other data sources and repositories is extremely flexible using industry standard file formats and using the Windows clipboard and OLE functionality WellCAD data types WellCAD is capable of handling a diverse range of borehole information all on one document. These data types include:
|
|
|
WellCAD Features
|
 |
 |
WellCAD tools:
|
|
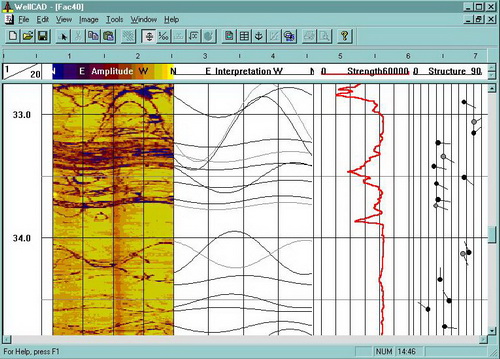
Application in L & TD – VSP.
WellCAD is powerful software and has been used for multi-purpose in L & TD. Since 1996 it has often been used for casing inspection quick look analysis plots. This picture presents a casing inspecting result in White Tiger oil field . |
 |
Nhóm Marketing
MITPro SOFTWARE
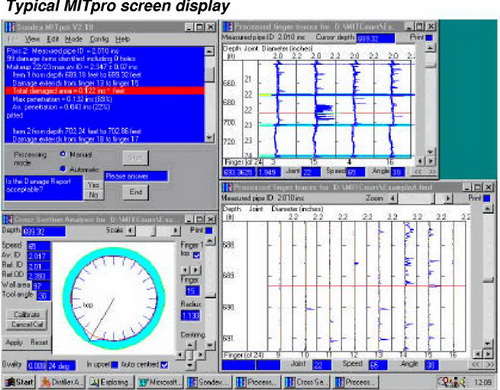 |
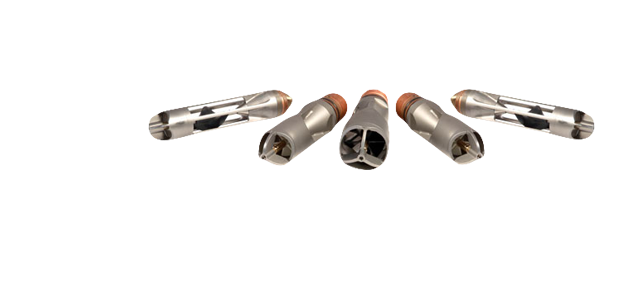
DESCRIPTION The Data Processing Software for the Sondex Multi-Finger Imaging Tool (MITpro software) performs the task of processing MIT raw data automatically, but under interactive user control. It reduces the tedium of manually analysing the data, producing consistent, reliable reports showing where and to what degree the pipe wall is damaged or scaled. The software locates |
|
collars in tubing or casing, using a range of specialised, automatic search algorithms. The results can be modified interactively, until a suitable description of every joint is obtained. To process the data, the software uses algorithms, which correct for tool decentring and fit the interior shape of the pipe locally. All deviations from the fitted shape are merged and classified into damage reports. The software configuration can be adapted to process the data from any type of survey, using any Sondex MIT tool. MITpro can generate highly reliable and consistent survey reports, which are stored as |
|
ASCII format disc files. These include Summary Report Files, which summarise the findings as a Joint Tabulation, and Process Report Files, which contain detailed damage information. The Summary Report can be printed out, to a high presentation standard, suitable for offering to end-users directly. Worst-case cross section plots can be generated and appended to the report automatically. Both metric and imperial formats are supported throughout. The MITpro software is a 32-bit application, which runs under Microsoft Windows 95 or Windows 98. The software can also run under Windows NT.
|
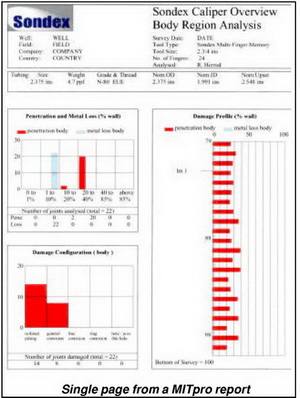 |
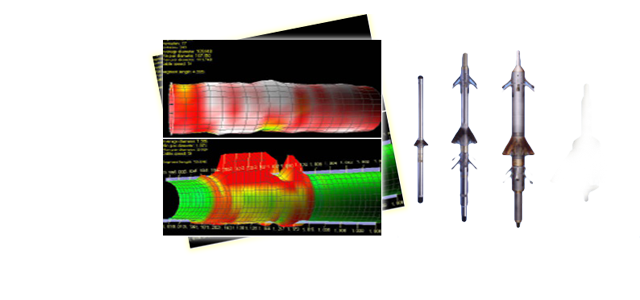
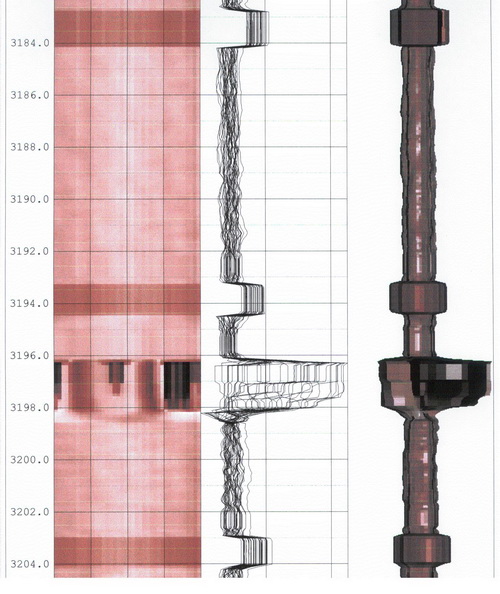
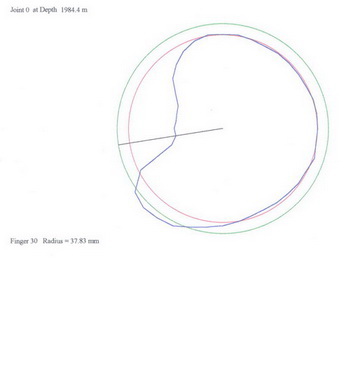
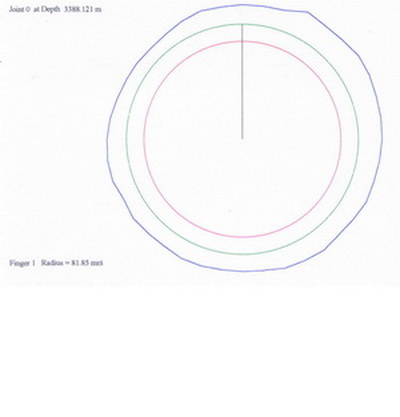
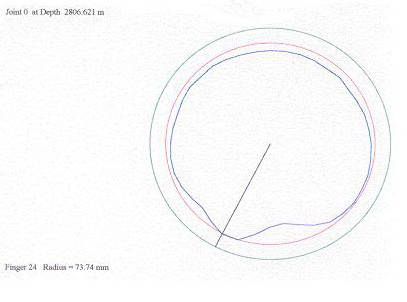
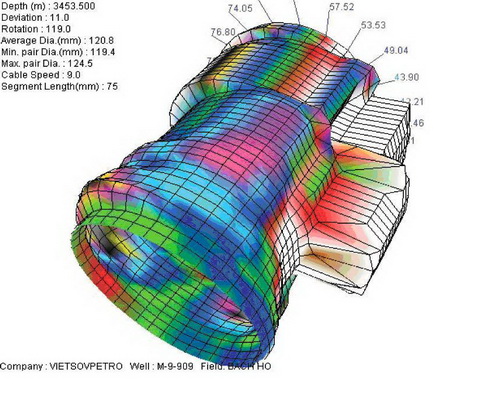
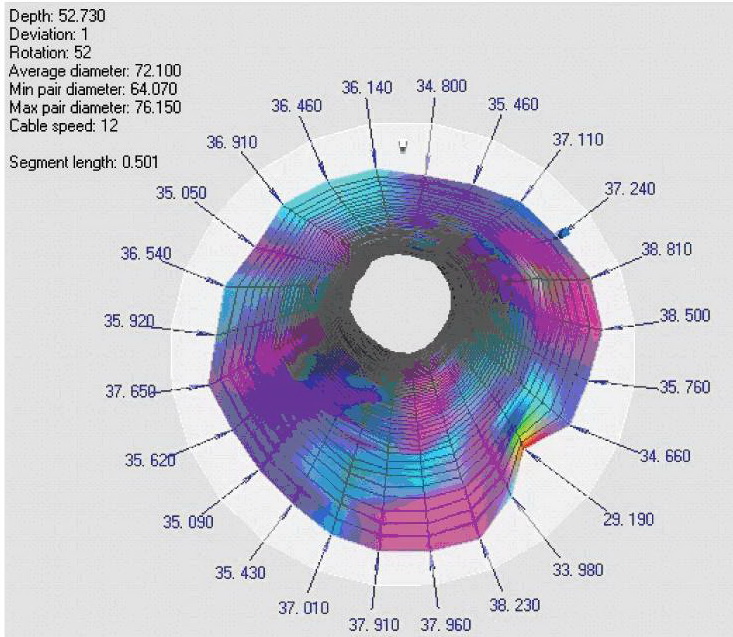
| Cross-sections produced by MITPro are very important to know the real status of the pipe in the well. MITPro has therefore been widely used in casing and tubing inspections in L & TD – VSP. These cross-sections combine with plots, produced by WellCAD and MITView software and are the most effective ways of showing pipe status.
Some pictures below were taken from the casing and tubing inspection results. Data source was recorded by MIT (24,40,60) tools in White Tiger oil field. |
 |
|
|
 |
 |
|
Nhóm Marketing
MITView SOFTWARE
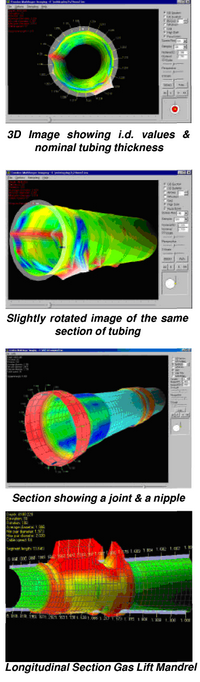 |
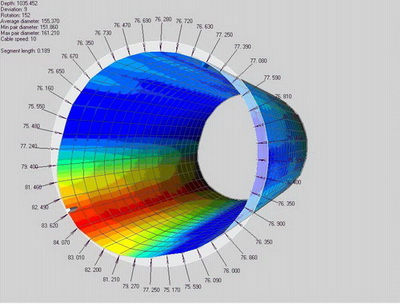
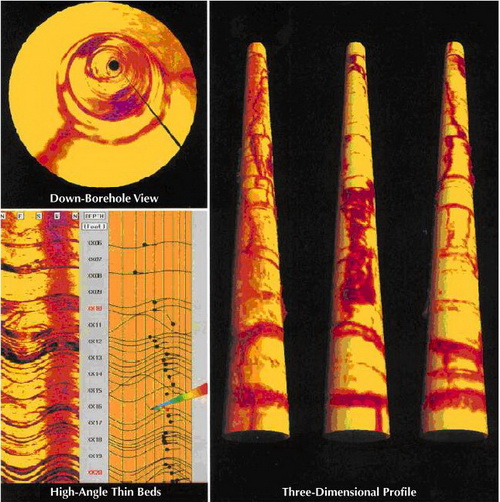
DESCRIPTION One of the most effective ways of understanding the condition of a well is to produce 3D images. To achieve this, we use a package called MITview
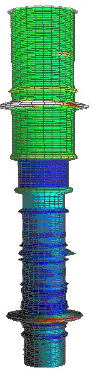 s of a particular job together with an operating version of the program. This allows the engineer responsible for the well to run MITView and examine the data himself s of a particular job together with an operating version of the program. This allows the engineer responsible for the well to run MITView and examine the data himselfExported images can be used to produce hard copy pictures suitable for use in written reports, for example the BOP shown on the right. |
| Some pictures below illustrate this software application in Vietsovpetro L&TD. Data was recorded by MIT (24,40,60) tools in White Tiger oil field. |
 |
|
|
 |
 |
|
Nhóm Marketing
Emeraude
|
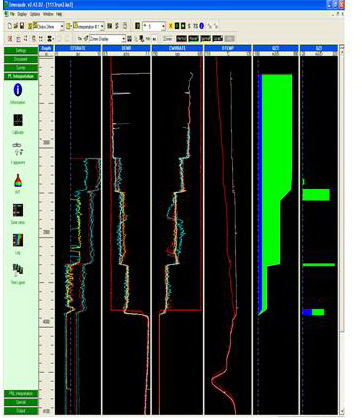
Emeraude has been uesd in Vietsovpetro L&TD since 2000.
This is one of the best production log interpretation softwares, an impossibly missing tool of reservoir monitoring.
In recent years production logging has moved from being considered as the tool of last resort to a powerful quantitative method that takes its own place in the set of data acquisition tools for the reservoir engineer.
This has been due to two factors: the lowering of acquisition costs using 'fit‑for‑purpose' tools and shifting the interpretation into the hands of the end‑user engineer by the development of client as opposed to tool focused software; Emeraude. In the past, PL was a highly specialized business. Data acquisition was made using expensive tools and interpretations were performed by engineers poring focused on the mechanical aspects of the tools and looking for specific well problems but not on the reservoir under study.
The realization of the value of the results of a production logging surveillance survey has given the reservoir engineer a powerful new tool in the drive for the more accurate and refined reservoir characterization.
All the major and most of the independent service companies as well as many operating companies now use Emeraude. Emeraude is seen as the industry standard allowing a common platform for communication and interpretation between service companies and the operators.
The latest version of Emeraude, Version 2.42, includes facilities for the interpretation of highly deviated to horizontal wells with specific processing for multiple‑probe tools. These include the generation of holdup/bubble images and the display of holdups inside a representation of the wellbore.
KAPPA remains committed to the ongoing development of the industry standard PL interpretation package, Emeraude. |
| METHODOLOGY
Reference channels / Spinner calibration An interpretation starts with the selection/definition of a Reference Channel for each available measurement. From the spinner passes ‑ if a spinner has been run ‑ the in‑situ calibration can be calculated on user selected calibration zones and a resulting apparent velocity channel is generated. PVT The fluid type is defined, and the PVT properties of each phase are represented using a wide variety of Black‑Oil correlations, for bubble point or dew point fluids. Each correlation can be matched to a set of user entered constraint points, to ensure that the model values are representative. |
 |
|
Zone Rates When all the required information has been entered, the user defines a number of calculation zones, outside the assumed inflow zones. Based on the fluid types and the available measurements Emeraude suggest a list of possible flow models and, for the one retained by the user, the software automatically calculates the cumulative phase rates on all the calculation zones. The rates are obtained using non‑linear regression, which makes it possible to supply any relevant set of inputs, and to possibly use redundant information. The solution rates are found by minimizing the error between measured and simulated values. Each difference (or residual) can be weighted separately. The following measurements are viable regression inputs: density, spinner apparent velocity, holdup of any phase, velocity of any phase, rate of any phase, mixture rate, mixture velocity, and temperature. The measurements may be continuous or stationary. The simulation is based on a full range of flow models from single‑phase to full 3‑phase situations, and a number of slippage correlations for those cases, in vertical or deviated wells. Specific models are also provided to handle flow re‑circulation (apparent down flow) as well as flow through a standing water/liquid column. In the Zone Rates option, the backbone of the interpretation, all the results relevant to the calculation on any particular zone can be visualized such as the flow regime, the slippage velocities, holdups, the flow map for the selected correlation, etc. The model / correlations can be modified, the velocities can be changed manually, and the surface conditions can be matched. etc. The solution can be examined in terms of actual contributions (rather than cumulative). Global Regression, solving simultaneously for all the contributions on the entire well, can be run if necessary. The Global regression can be used as a second path to impose constraints on the solution. Constraints can be individual sign constraints (producing zone or a thief zone). Contributions can be manually edited and/or fixed to a given value. This helps finding a coherent solution when standard methods fail. |
Nhóm Marketing
Basroc A Special Software For Basement
|
The fractured basement reservoir is characterized by a very complex structure and it requires a special method to evaluate. BASROC is one of those. The software BASROC was developed by VSP in 1992, for application in reservoir evaluation and simulation for Bach Ho oil field. In order to increase the utility and accuracy in the determination of reservoir parameters, this software has been upgraded continuously. Version 3.0 is the latest version now used in evaluation and simulation of basement reservoirs in Bach Ho, Rong and other oil fields. |
Reservoir model – two porosities and two permeabilities:
|
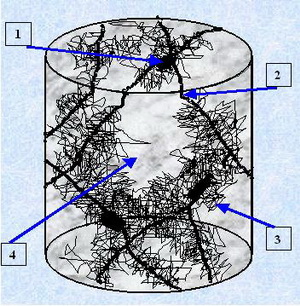 |
Pig.1: Pore Space Structure Fractured granite.
1-Vug Porosity, 2 -Macro Fracture, 3- Micro Fracture, 4-Unchanged Rock. |
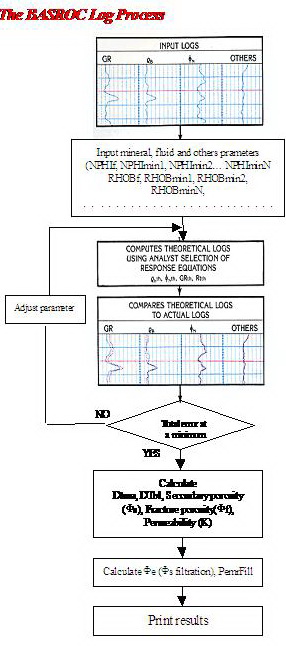 |
The important features in BASROC 3.0
BASROC is an advanced multi-mineral log analysis program. It computes the most probable formation mineralogy and total porosity, open porosity using a multi-log, least-squares inversion technique. It is particularly valuable in areas of mixed lithologies, special minerals and two porosities systems. Grade porosity by filtered method. Calculate fracture porosity by looped technique. Export the result in the tabular and bitmap files. Any Microsoft Windows supported printing device.
|
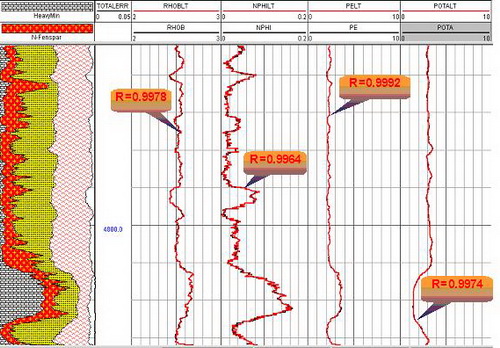
Fig. 2 – The comparison of theoretically synthetic and practical curves
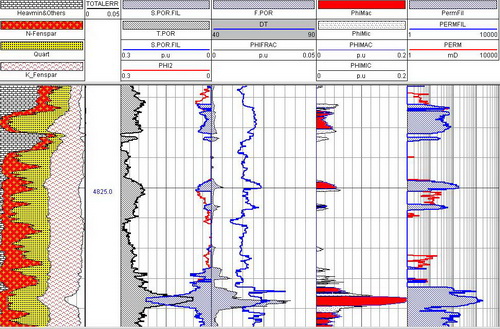
Fig. 3 – Results of BASROC processing for fractured Basement |
Nhóm Marketing
Imager Analysis
|
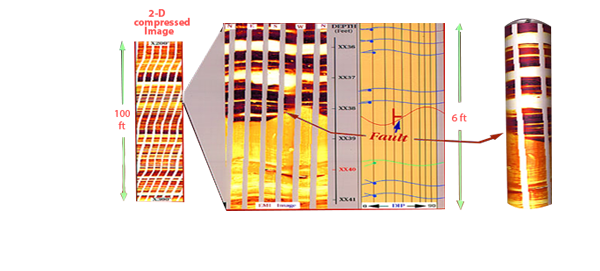
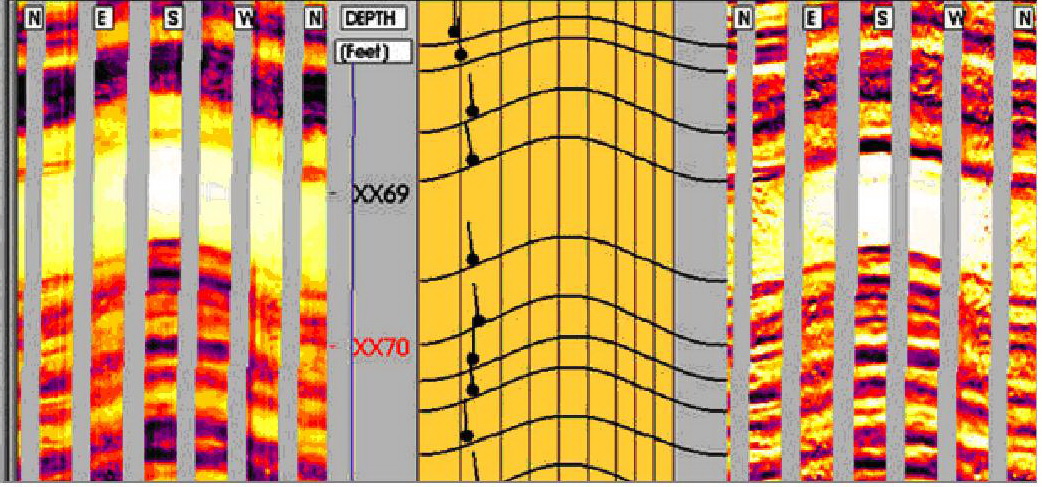
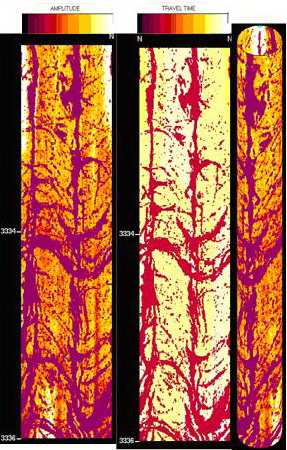
Imager is an interactive image interpretation software package used to present and analyze vector data from the Circumferential Acoustic Scanning Tool (CAST), Electric Micro Imaging (EMI) tool, the Formation MicroScanner™ (FMS) tool, and the Fullbore Formation MicroImager (FMI) tool. Imager allows displaying the logged data graphically in various ways. The images may be enhanced to emphasize certain features, facilitating the interactive calculation of dip and fracture information.
For CAST service, Using Imager, we can:
For EMI Service, using Imager, we can:
Calculate the dip angle and direction of bedding, fractures |
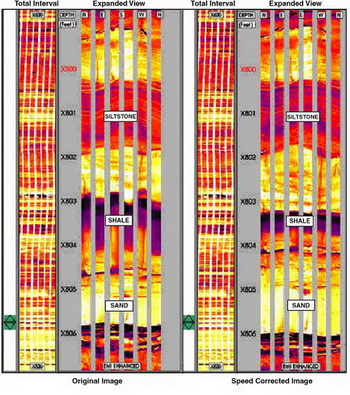 |
Comparison of EMI Images with speed correction applied. |
|
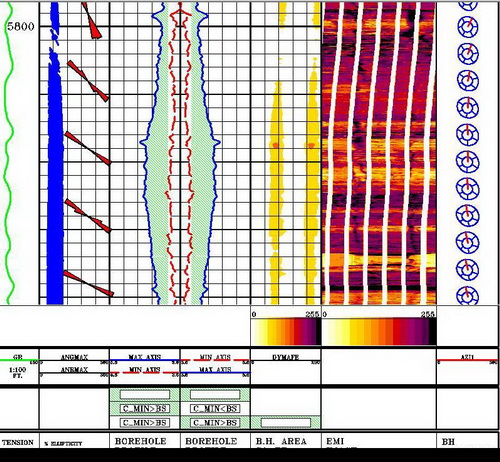
Imager analysis program window Geometry and Stress analysis |
Nhóm Marketing
Full Wave Sonic Analysic
|
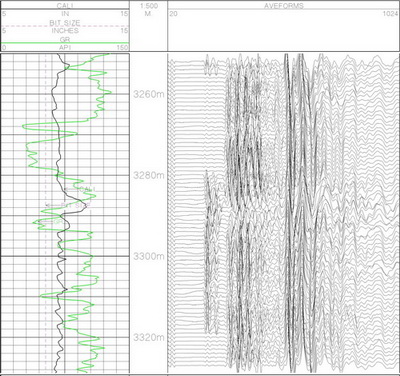
FULL WAVE SONIC tool measures compressional wave, shear wave and stoneley wave in a waveform.
*FullWave module. Using a fullwave module we can present and analyze fullwave acoustic data. The program allows displaying the logged data graphically in many ways. The data images can be enhanced to emphasize certain features. The following analysis techniques are available with FullWave:
Beside that, FullWave module allows the use of Kaiser and Finite Impulse frequency filters and from that we can see and analyze compressional wave, shear wave or stoneley wave independently. *RockXpertTM Analysis module. Critical Information for Fracture Designs and Well Plans
|

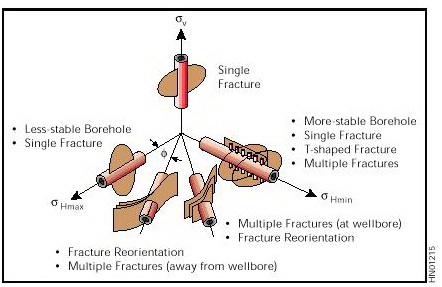 |
The declination of a horizontal wellbore with respect to the principal horizontal stress can have a significant effect on wellbore stability and fracture geometry. RockXpert logs can aid in well planning to minimize borehole instability and to maximize the effectiveness of fracturing operations. |
|
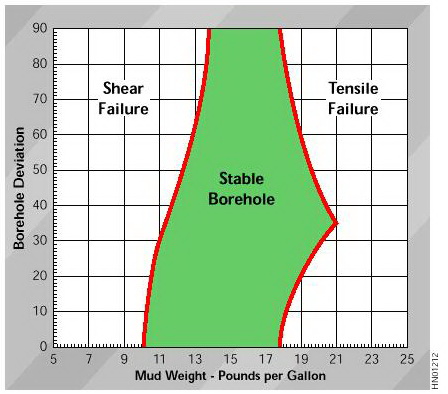
At any specified point along a proposed or existing well path, RockXpert analysis can identify stable borehole conditions as a function of mud weight and borehole deviation. |
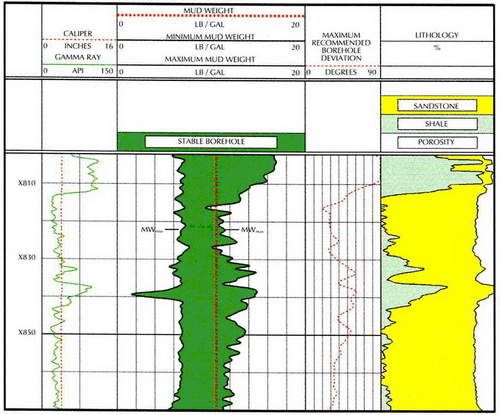
RockXpert logs indicate the safe mud-weight range to provide sanding and formation breakdown, as shown in Track 2. The logs also include gamma and caliper curves in Track 1, predicted maximum borehole deviation in Track 3, and lithology information in Track 4. |
|
STRES, FRACHT, FRACPAR, FWSIWC modules allow us to estimate:
|
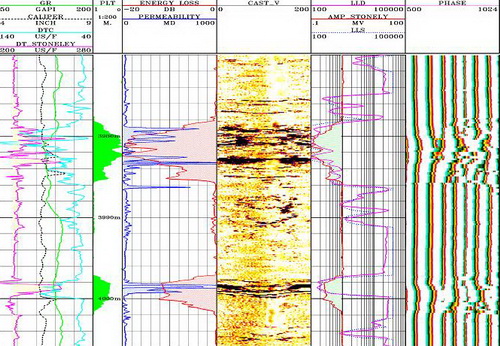 |
This plot shows potential zones in White Tiger fractured basement by means of the energy loss of Stoneley wave (Track 5), in fact, these zones are highly productive |
Nhóm Marketing
SASHA SAnd SHale Analysis
| SASHA is one of the most useful and effective softwares in petrophysical analysis. The program has two basic options to evaluate these parameters: · The general case when any type of hydrocarbons may be present and hence the density of hydrocarbons is not known. · When density of hydrocarbons is known and there is little or no invasion. This option is primarily designed to evaluate tight gas sands where the density of gas is usually known and there is no invasion due to very low permeability.
Shale content is computed from one or several (as a minimum) of the following shale indicators: Gamma Ray, SP, Deep resistivity curve, Thorium, Potassium, Thorium+Potasium, Neutron, Density-Neutron cross plot, and Density-Acoustic cross plot; or an external shale volume Vsh is used for the volume of shale. Porosity is computed from the Density-Neutron cross plot or Density-Acoustic cross plot or single porosity logs: Density, Neutron or Acoustic. Salt and coal can be identified when necessary by setting flags and cut-off values. SASHA also corrects for the excavation effect (if desired). Several equations are included to compute water saturation: Archie. Permeability can be computed from one of two equations: Timur or Wyllie-Rose. Effective permeabilities for hydrocarbons and water are also computed |
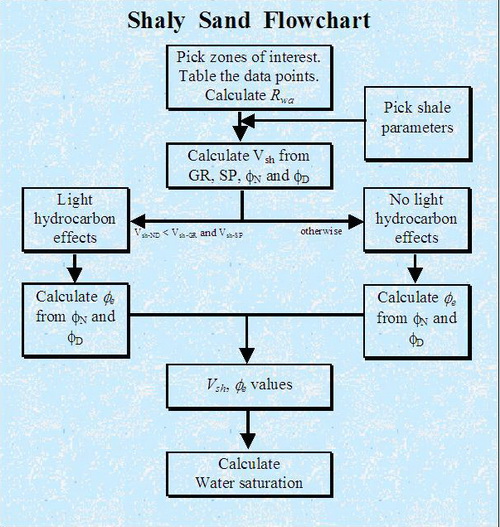
| This program has been used popularly in L&TD for shaly sand reservoirs. Tool response equations available are SP, GR, Rt, Rxo, density, neutron and sonic. The figure 1 shows result of SASHA processing for Shaly Sand reservoirs. The unknowns are porosity, clay volume, sand volume, water saturation, water saturation in flushed zone, hydrocarbon density, and permeability index.
|
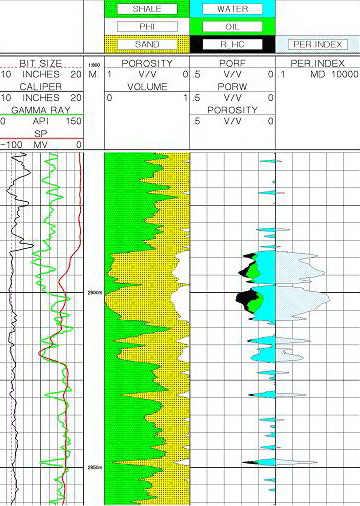 Fig. 1 – Results of SASHA processing for Shaly Sand |
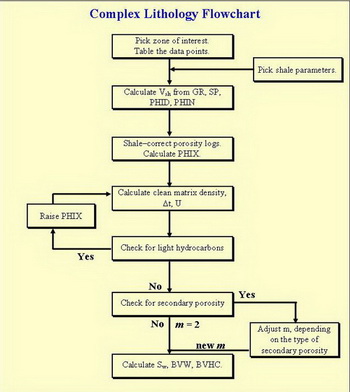
CORAL Complex Reservoir AnaLysis
|
CORAL Analysis provides an accurate detailed description of reservoirs and mixed lithology. Its primary use is in the evaluation of formations, which contain shale, sand, limestone, dolomite, anhydrite, and gypsum. Minimum log data consists of a gamma ray or spontaneous potential log; a density, neutron, or sonic porosity log; and an induction or laterolog resistivity log. Improved results are obtained if photoelectric (Pe), shallow resistivity, sonic, dielectric, and spectral gamma ray data are used. These logs will provide determination of shale content, cross plot lithology (sandstone-limestone or limestone-dolomite), anhydrite content, porosity, secondary porosity or gypsum (if an acoustic log is available), permeability and water saturation. If it is known that there is no limestone in a formation, the combination of sandstone-dolomite can be evaluated. |
|
This program has been used popularly in L&TD for sedimentary rock evaluation. Tool response equations available are SP, GR, Rt, Rxo, density, neutron and sonic. Figure 1 shows the result of a CORAL processing for Shaly Sand-Lime-Dolomite with coal. The unknowns are porosity, clay volume, sand volume, water saturation, water saturation in flushed zone, hydrocarbon density, lime volume, dolomite volume, coal volume, and permeability index.
|
Fig. 1 – Results of CORAL processing for Shaly Sand-Lime-Dolomite with Coal
Nhóm Marketing |
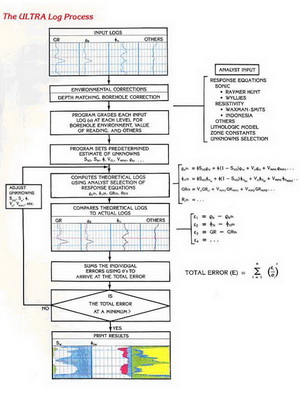
ULTRA Universal Logging Tool Response Analysis
| ULTRA is one of the most famous software in petrophysical analysis. It is a very powerful, useful and effective program. This program is a set of software modules, designed to process wireline logs. ULTRA program is based on an optimization approach, computing the most probable parameters from the set of logs and local knowledge of the logging environment.
This is a weighted-least-squares error minimization technique which provides the analyst extensive flexibility to choose parameters, log measurements, and interpretive models. The affects of trace minerals, such as pyrite or ankerite, can be accurately evaluated with the ULTRA program. The analyst can also incorporate core results and other petrophysical data into ULTRA analysis to enhance the interpretation. Tool response equations are available for the following: SP, Gamma Ray, Natural Spectroscopy Gamma Ray, Bulk Density, Photoelectric, Sidewall Neutron, Sonic Log, Pulsed Neutron/TMD/Neutron Lifetime, Dielectric Constant/EPT. The following Log Analysis Models are built in: Shaly Sand, Sand-Lime-Dolomite with up to six other minerals and clay, Sand-Lime-Dolomite with up to six other minerals and shale represented as a mixture of clay and silt, Lime-Dolomite with up to six additional minerals and clay, Igneous and metamorphic reservoir model. Core data are used quantitatively in the minimization process. Fracture and secondary porosity may be determined in one of two possible ways:
|
 |
Vietsovpetro and L&TD have selected ULTRA program because it is the best log interpretation software available
Adaptable – for operation on a variety of systems, including but not limited to Vax, HP, IBM and Apollo
|
|
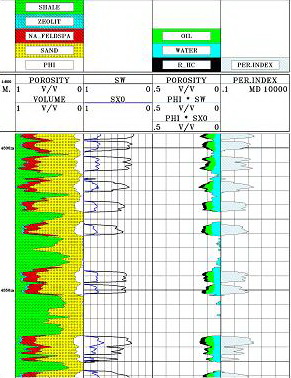
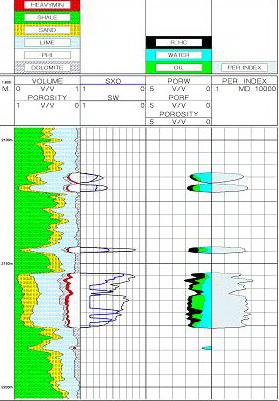
This program has been popular in L&TD for sedimentary and basement rock evaluation. Figures 1 & 2 show results of ULTRA processing for two sedimentary models. The Sand-Lime-Dolomite with other mineral and clay (Fig.1) and Shaly Sand with another minerals (Fig.2) had been chosen for use with porosity, clay volume, sand volume, water saturation, flushed zone saturation, hydrocarbon density, lime volume, dolomite volume and another mineral volumes as the unknowns. Figure 3 shows a result of ULTRA processing for a basement model. The unknowns are porosity, quartz volume, kali-feldspar volume, plagioclase volume, and another mineral volume.
|
Fig. 1 – Results of ULTRA processing for sedimentary rock |
|
Fig. 2 – Results of ULTRA processing for Shaly Sand with another minerals |
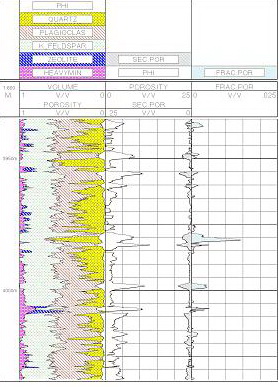 Fig. 3 – Results of ULTRA processing for Basement |
Nhóm Marketing
DPP&PETROSITE Desktop Petrophysics Software
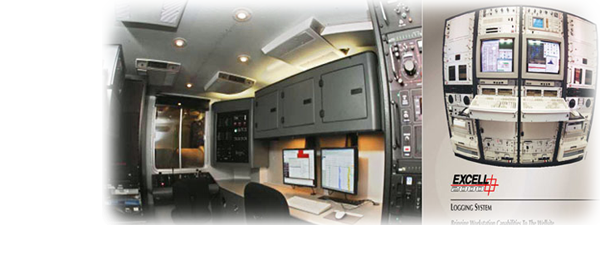
In order to provide the best results from wireline logging data processing/interpretation, from 1997 Vietsovpetro L&TD starting to utilize a full range of processing/interpretation programs. This is Halliburton’s Desktop Petrophysics software and Petrosite software running in a complete system. The system comprises two IBM-RS-6000 servers running in AIX environment with six terminals connected through a LAN and one HP workstation running in Window environment. This is a multi task and multi-user system. 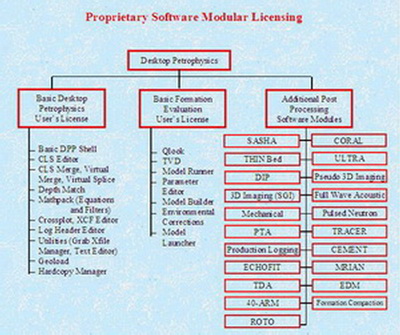 |
| Halliburton’s Desktop Petrophysics (DPP) and Petrosite are integrated software packages that converts, stores, analyzes, and manipulates log data. The Desktop Petrophysics&Petrosite suite of applications allows the user to manage and manipulate log data for further evaluation and interpretation.
The DPP & Petrosite applications run cohesively in a common “desktop” environment under OSF/Motif TM, thus offering a consistent user interface based on the X-Window system.
All DPP& Petrosite applications run from a common CLS database, and use a single messaging system to communicate with one another. |
Offered as a package, but available as individual applications, Desktop Petrophysics&Petrosite provides the tools needed to meet the demand for more in-depth reservoir analysis and evaluation.
The DPP & Petrosite applications are grouped. There are main groups: Basic Desktop Petrophysics, Basic Formation Evaluation Package and Additional Post Processing Software Modules. Each application in the Desktop Petrophysics & Petrosite suite is described briefly below. |
| A- BASIC DESKTOP PETROPHYSICS & PETROSITE PACKAGE
GEOLOAD Converts Log Data between CLS Database format and LIS and LAS formats. Also can output ASCII file and verify LIS. CLS EDITOR View and edit Log Data in CLS Database file in value versus sample depth matrix. Create, delete, rename or copy curves. SCROLLPLOT Interactively display CLS log data on screen, or output as TIFF file. Annotate logs, label/rescale curves, plot special curves (waveform, image, dip arrow, etc.). SPC EDITOR Build/edit a Scroll Plot Control file (.spc) to format plots run from the Scroll Plot program. |
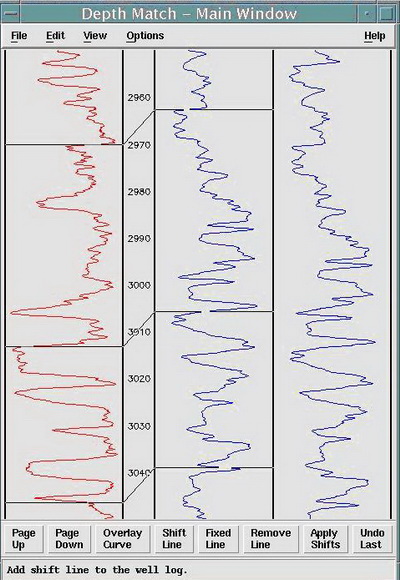 DEPTH MATCH Graphically stretch, compress, or linearly shift curves in CLS Database. DEPTH MATCH Graphically stretch, compress, or linearly shift curves in CLS Database. |
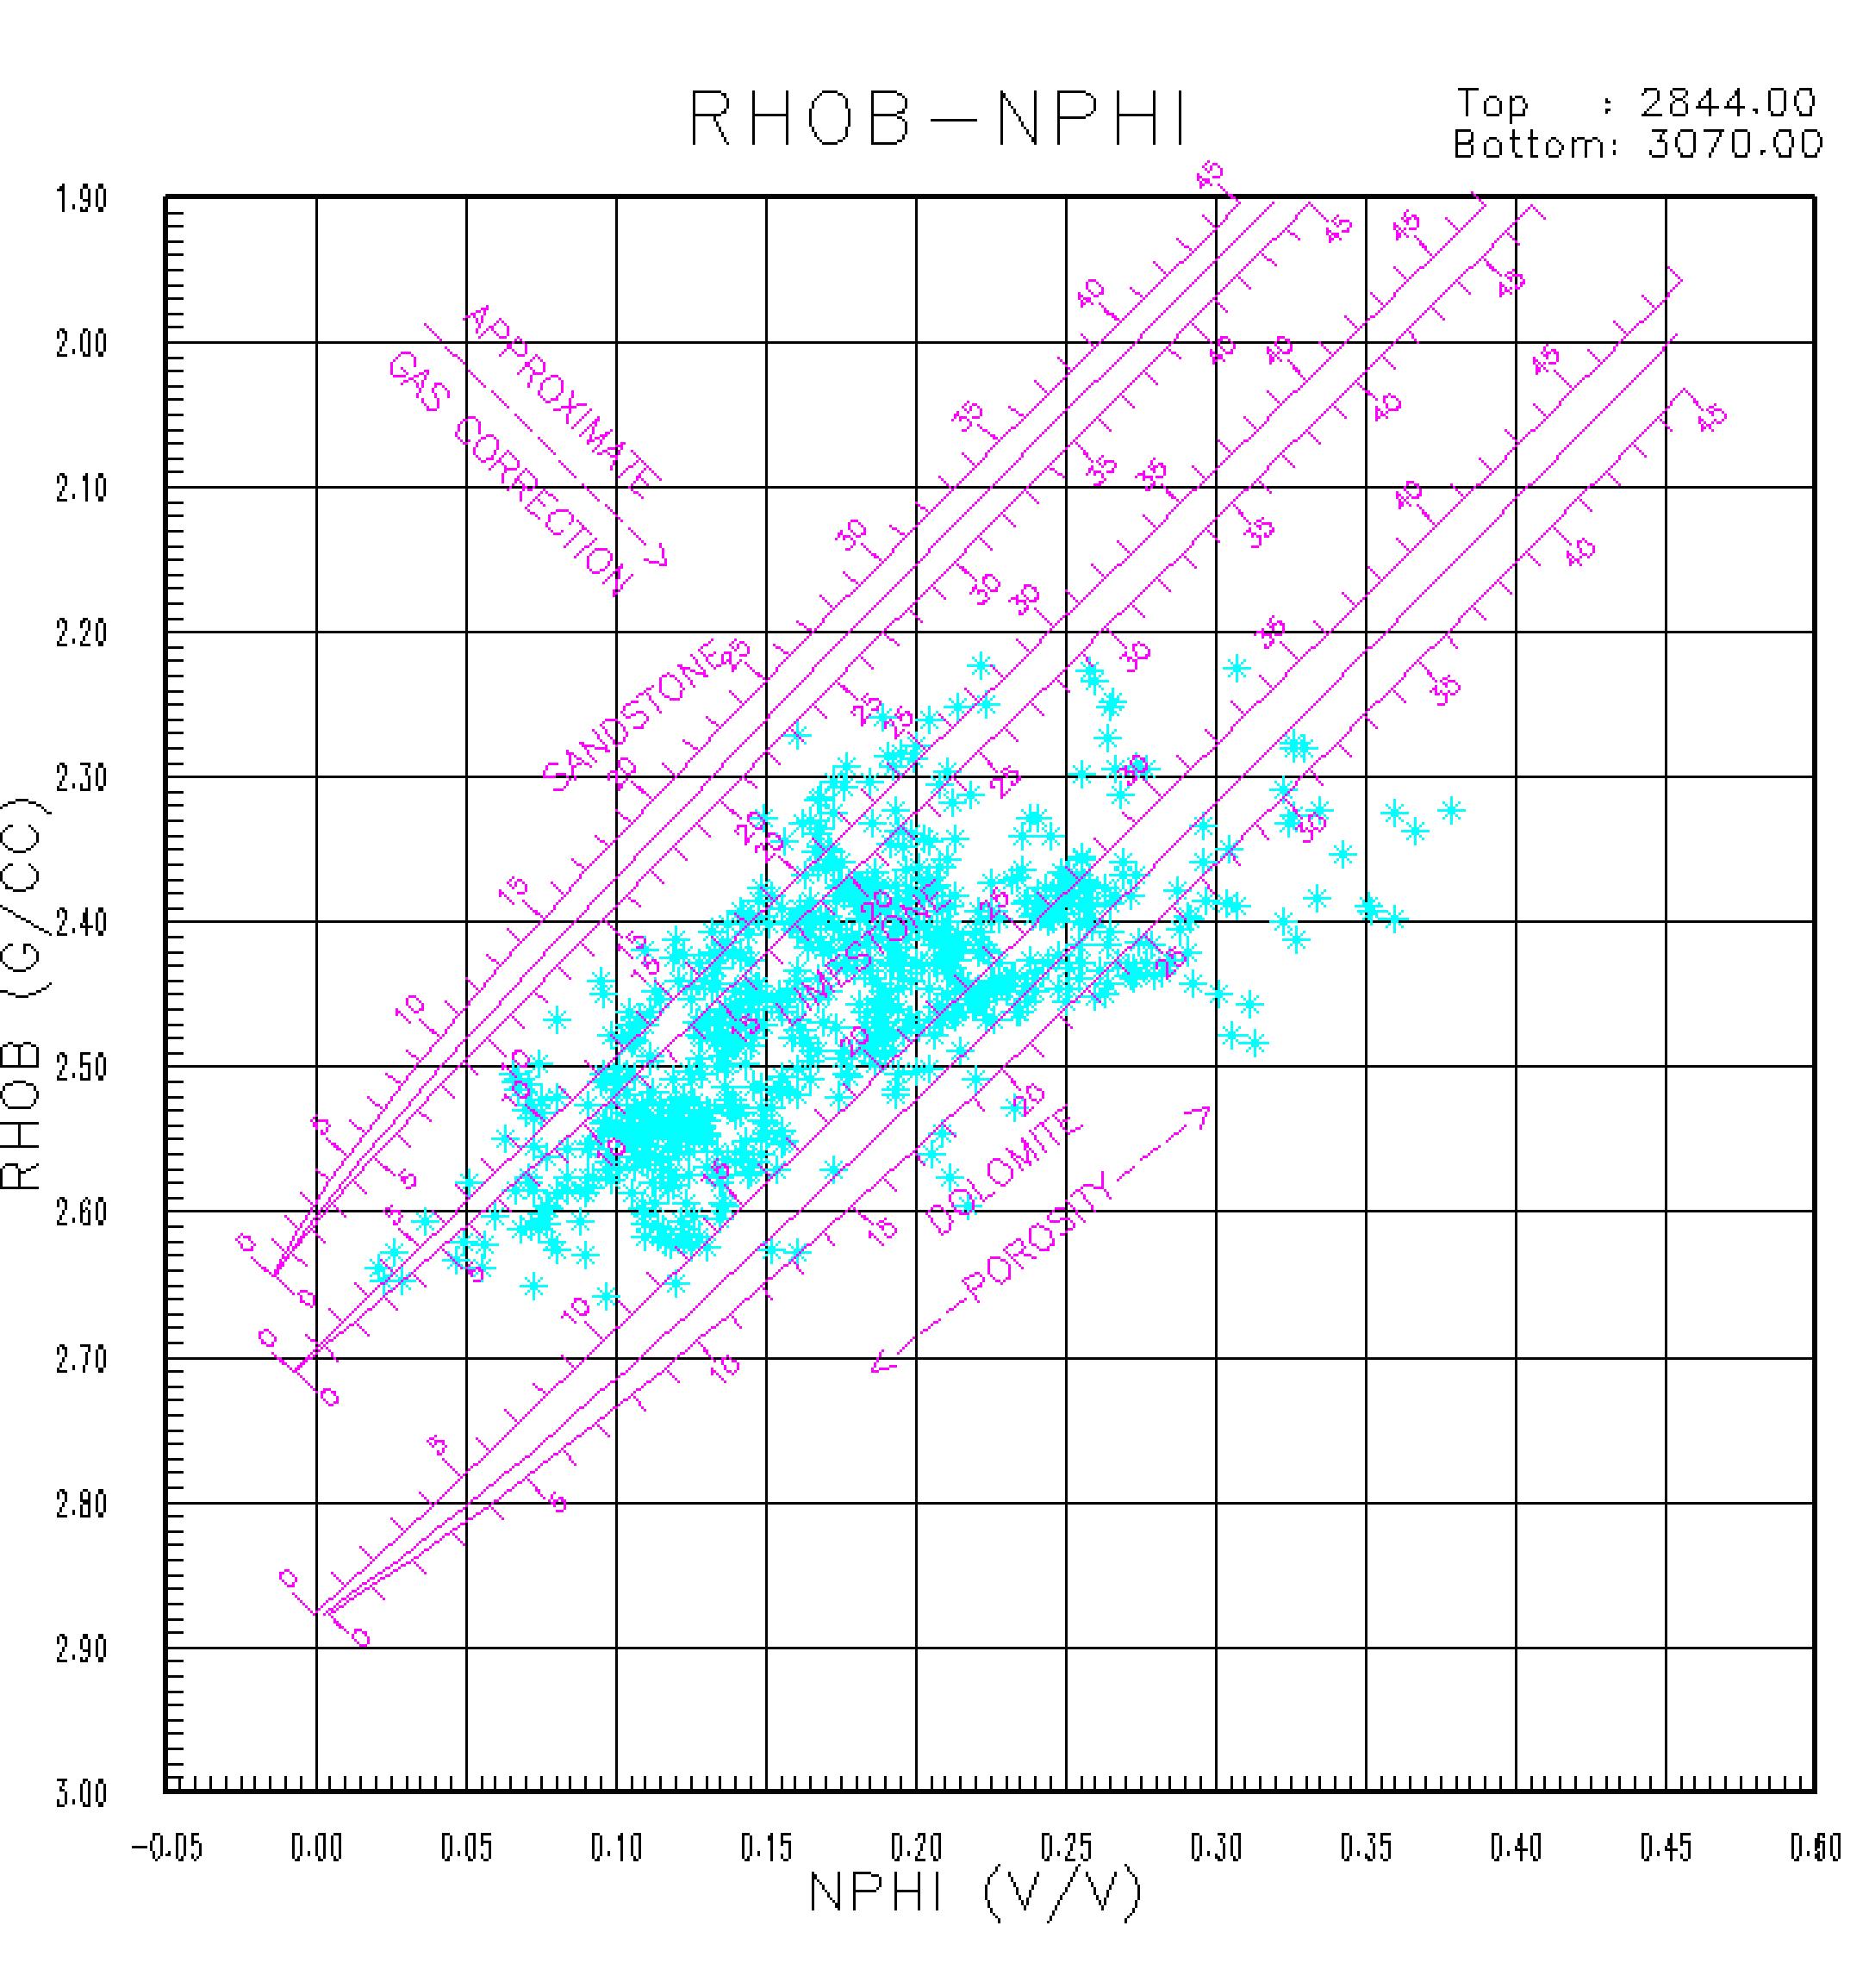
XCF EDITOR Build/edit a Cross Plot Control file (.xcf) to format plots run from the Cross Plot program. |
|
HARDCOPY MANAGER Plot TIFF file of logs, cross plots, and screen dumps on selected plotter. MATHPACK Perform mathematical, logical, filter operations on CLS database curves, and save processing steps as user programs. Display data histogram with statistical calculation. LOG HEADER EDITOR The Log Header Editor program is used to generate API standard log headers to include with plots produced by other Desktop Petrophysics application. You can select from a list of header types that include Open Hole, Cased Hole, and Formation Tester. The Log Header Editor program has the option to read the information stored in the CLS database. The HardCopy Manager program to generate the header plots for the different plotters uses data saved by the program. B- BASIC FORMATION EVALUATION PACKAGE QLOOK is a quicklook to complex reservoir analysis model. Although the program will function with a minimum of one porosity data input, one clay determination data input and one deep resistivity data input; it provides improved results with additional input data. The program determines any 3 mineral combination from a list of 17 available minerals; plus clay; when density-neutron-Pe-resistivity data are available. When sonic travel time is added, the sonic enhances the program’s ability to deal with bad hole or to provide secondary porosity determination or both. The addition of flushing zone resistivity allows for a moveable hydrocarbon plot. QLOOK features several computational options including: selection of desired clay indicators, selection of gamma ray – Vcl transformations, and selection of water saturation models. QLOOK contains a microlog indicated permeability routine that complements the standard computed results if micro-electric data is present. |
|
Model Builder This feature enables anyone with Fortran programming knowledge to develop analysis or other data manipulation programs which can access the CLIS database well file in a simple and straightforward manner. The model developer generates two files, a .MDS file which specifies the input and output parameters and processing options, and a .MDL file which contains the Fortran algorithms. The system will then build an executable program that allows Model Runner access the CLIS database and JOBVAR database as required.
Model Runner Sets up model control parameters and interactively run the model.
Parameter Editor Edit environment parameter values used in analysis models by user-defined depth zones and store in parameter database.
Environmental Corrections Library for both Halliburton and Schlumberger tool responses. |
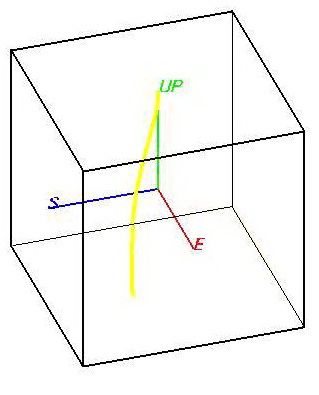 TVD
TVD| C- ADDITIONAL POST PROCESSING SOFTWARE MODULES
CORAL (COmplex Reservoir Analysis Lithology) This model provides an accurate, detailed description of reservoirs with mixed lithology. Its primary use is in the evaluation of formations, which contain shale, sand, limestone, dolomite, anhydrite, and gypsum. Minimum log data consists of a Gamma Ray or Spontaneous Potential, Induction or Laterolog resistivity, and Neutron and Density logs. Improved results are obtained if photoelectric (Pe), shallow resistivity, Sonic, Dielectric, and Spectral Gamma Ray data are used. SASHA (SAnd SHale Analysis) This model is designed to evaluate shaly sand reservoirs. The program computes the volume of shale, type of clay distribution, porosity, density of hydrocarbons, and water saturation. SASHA analysis is based on the Density-Neutron cross plot. Limited computations can also be accomplished when only one porosity device, or the combination Density-Sonic is available.THIN BED LARA (Laminated Reservoir Analysis) This makes use of dipmeter (or other high-vertical-resolution shale indicators) and a standard openhole log suite to analyze thinly laminated shaly sand reservoirs where clay content varies with depth. LARA’s algorithms determine shale volume, clay distribution, porosity, water saturation, and hydrocarbon density of thin-bedded formations. ULTRA (Universal Logging Tool Response Analysis) This is a weighted-least-squares error minimization technique which provides the analyst extensive flexibility to choose parameters, log measurements, and interpretive models. The effects of trace minerals, such as pyrite or ankerite, can be accurately evaluated with the ULTRA program. The analyst can also incorporate core results and other petrophysical data into ULTRA analysis to enhance the interpretation. |
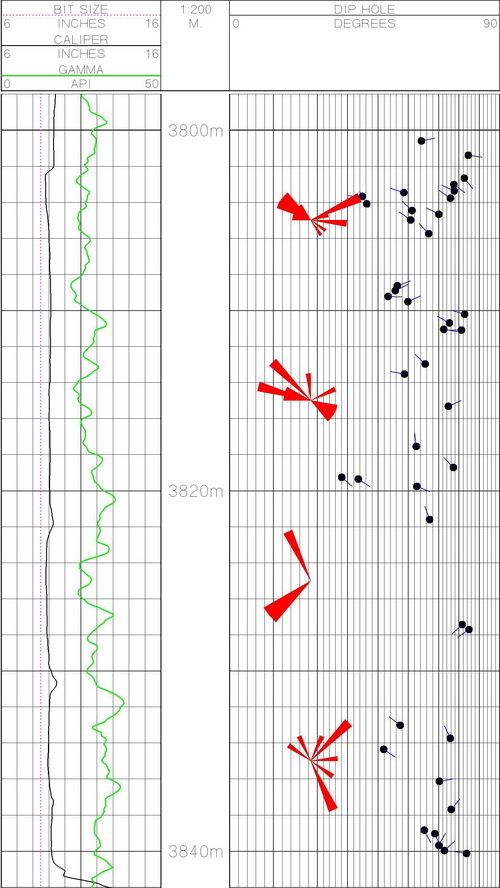 |
DIP ANALYSIS SHIVA A planar global mapping computational module for four or six arm dipmeters. SHIVA analysis relies on a weighted-least-squares optimization approach to make optimum use of redundant data. OMNI A global mapping computational module for curved surfaces for six arm dipmeters. OMNI is a variation of SHIVA analysis that evaluates non-planar bedding. If dips are planar. OMNI will produce the same dip angle and azimuth as SHIVA analysis. ORATOR Oriented resistivity processing of dipmeter data for fracture detection. ORATOR results also indicate the orientation of fracture anomalies. The ORATOR plot is made by comparing each diameter pad’s measurement with that of the adjacent pads.
|
|
IMAGING - Pseudo 3D or Advanced 3D
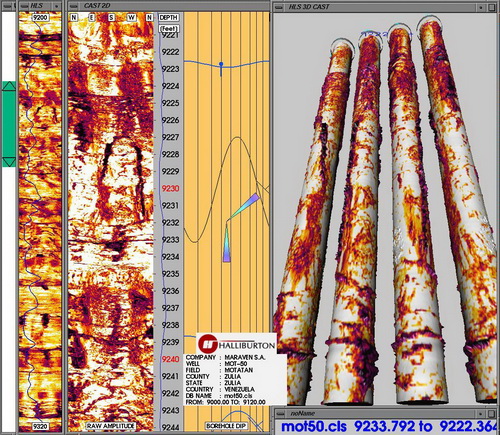
CAST Image enhancement of CAST data can be done to improve geologic interpretation, fracture analysis, and bed definition. This model allows histogram equalization of CAST data. CAST images can be plotted as 360 o two-dimensional or three-dimensional cylindrical images that can be rotated. Interactive dip and fracture plot can be obtained by matching a sinusoidal to the image features.
EMI Image enhancement of EMI data can be done to improve geologic interpretation, fracture analysis, and bed definition. This model allows histogram equalization of EMI data. EMI images can be plotted as two-dimensional or three-dimensional cylindrical images that can be rotated. Interactive dip and fracture plot can be obtained by matching a sinusoidal to the image features |
 |
 |
FULLWAVE ACOUSTIC allows processing of the acoustic waveform to compressional, shear and stoneley components by semblance correlation |
|
Mechanical Properties allows for rock elastic properties from Acoustic Dt compressional and shear combined with density measurements via ROCKXPERT. TRANSIENT PRESSURE (Pressure Transient Analysis) PTA evaluates the raw pressure-versus-time data recorded by formation testers. PTA output includes a modified pressure-versus-time plot, formation permeability and initial formation pressure. Both radial and spherical flow models are available and the results can be plotted as Horner or derivative plots.TRACERSCAN Seven models are used to evaluate the vertical and radial locations of radioactive tracer isotopes used to tag fracture, gravel pack, or cementing operations. The program uses CSNG spectra in a weighted least squares fitting technique to determine distributions for single or multiple tracers. |
Nhóm Marketing