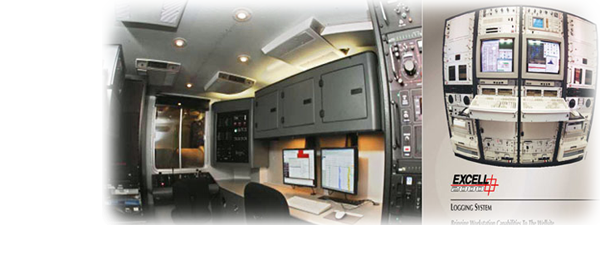
L&TD
LOGGING & TESTING DIVISION
Open hole logging
MWD/LWD
I/ INTRODUCTION
Measuring the properties of geological formations and reservoir fluids has traditionally been performed with logging tools run on an electric wireline, a technique that was developed in the 1920’s.
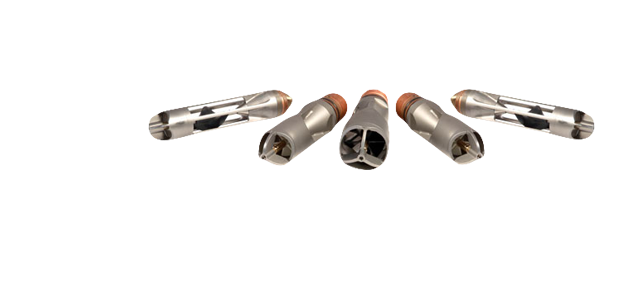
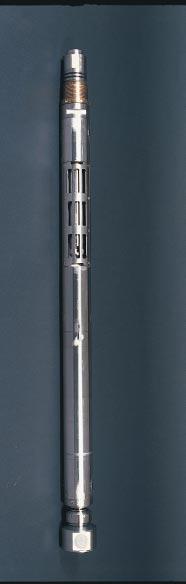
CAST-V Circumferential Acoustic Scanning Tool-Visualable
|
CAST-V – A COST-EFFECTIVE TOOL TO EVALUATE THE POTENTIAL ZONES IN FRACTURED BASEMENT.
The newest generation Circumferential Acoustic Scanning tool, the CAST-V made by Halliburton, provides a wealth of information in both open and cased holes. In open holes, the CAST-V provides complete borehole imaging for accurate formation evaluation. In cased holes, ultrasonic pipe inspection and cement evaluation can now be obtained simultaneously. Operating over a wide range of downhole environments, the CAST-V data can be presented in a variety of two- and three- dimension formats. Powerful, yet user-friendly imaging analysis software is available to process the images, histograms and curve-type data. |
 |
Specifications
|
 |
|
Primary applications include: • Open Hole Borehole Imaging. • Fracture Detection. • Casing Inspection (Both Thickness And Diameter). • Ultrasonic Cement Evaluation/ Imaging. |
|
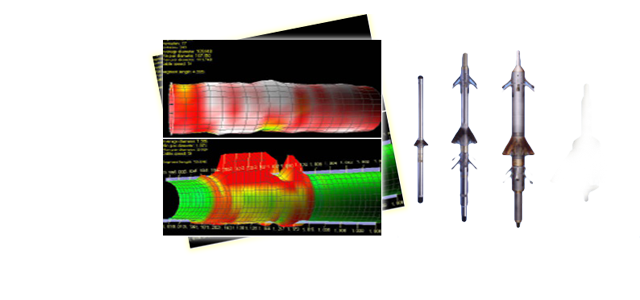
CAST-V HAS BEEN USED POPULARLY BY L&TD, VSP FOR STUDYING THE CHARACTERISTICS OF FRACTURES IN BASEMENT, The energy levels of reflected ultrasonic wave have been used: - To locate the fracture zones. - To differentiate between open fractures and filled fractures. - To determine the geometric characteristics of fractures: dip, azimuth dip, and aperture. In fact, surveys in basement of Cue long basin indicated that CAST-V is the most effective tool for studying basement fractures. |
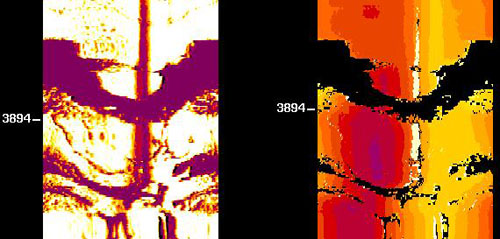 |
This open-hole CAST-V imaging was logged from fractured basement reservoir of White Tiger oil field. The upper plot shows clearly the open fractures both on amplitude (left) and transit time (right). These fracture zones are highly productive zones. |
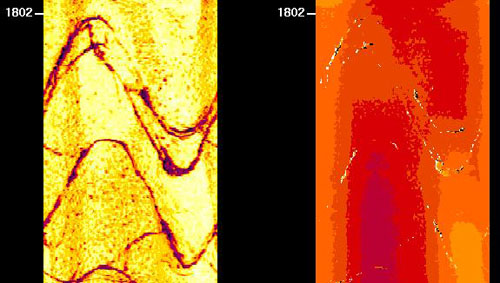 |
This plot clearly shows the closed fractures both on the amplitude (left) and transit time (right). These fracture zones are non-productive zones |
 |
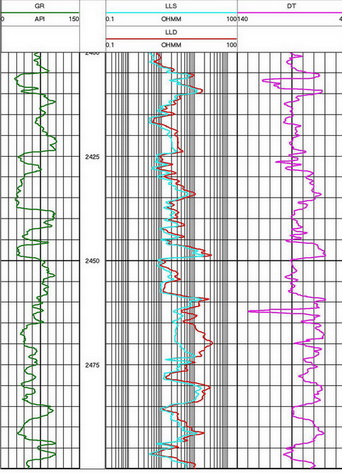
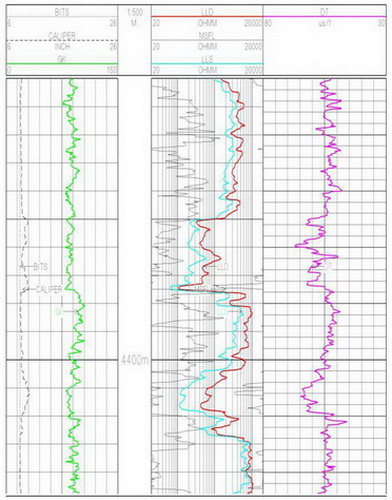
A productive zone was identified by CAST-V and traditional log (LLD, LLS, DT, NPHI, RHOB etc) measurements. This was confirmed with production logging data |
Nhóm Marketing
High Resolution Induction
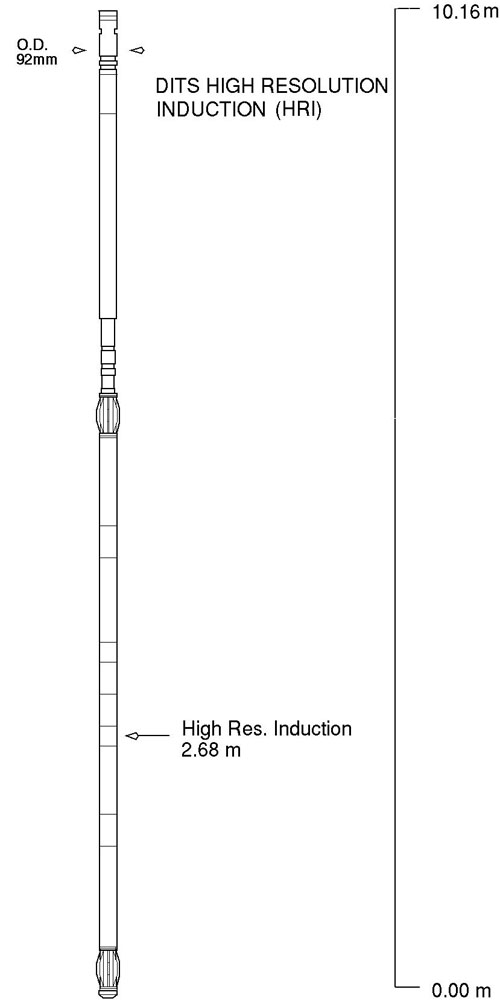 |
HRI Tool specification
|
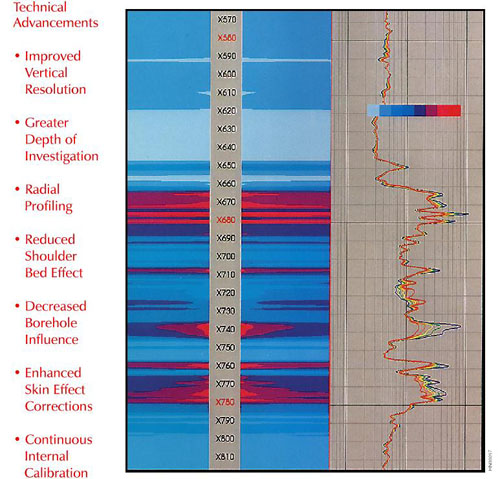
| As the search for new oil and gas resources continues, more and more exploration and development is targeted toward so-called unconventional reservoirs. Drilling objectives include interceded sand-shale sequences, thin beds, low-resistivity pay sands, and beds with little resistivity contrast from their surroundings. While the detection and evaluation of many of these reservoirs often exceed the capabilities of conventional resistivity devices, significant technical advancements allow HRI tools to locate and provide accurate information about such zones, which may otherwise be bypassed
Thin beds Reservoir intervals less than 10 feet thick comprise numerous primary and secondary exploration and development objectives. Utilizing reduced shoulder bed effects and improvements in vertical response, HRI logs resolve beds as thin as 2 feet. Laminated Sand-Shale Sequences Marine depositional environments and fluvial flood plains commonly contain laminated sand-shale sequences. Decreased shoulder response and improved vertical resolution again enhance interpretation in these situatio |
| Additional Secondary Objectives
By detecting thin beds and using quadrature processing to improve tool response, HRI logs can locate additional, potentially productive zones not indicated by other logging devices. While some primary objectives may not require HRI advantages for evaluation, HRI logs can illuminate secondary production possibilities for completion attempts. Without HRI information, numerous profitable secondary objectives could be permanently overlooked. Groningen-Effect Environments Below massive, highly resistive formations, deep laterolog devices read abnormally high resistivities. This phenomenon is known as the Groningen-effect and normally masks any productive zone below the massive resistive bed. HRI logs display no Groningen-effects. Oil-Base Muds Focused resistivity devices such as laterolog, spherically focused, and microspherically focused tools are designed to operate in an electrically conductive borehole medium and thus do not function effectively in oil-base muds. This requirement is not applicable to HRI tools; consequently, they are able to operate in oil-base muds and air-filled boreholes. Turbidites Deeper water exploration targets and many land prospects commonly include turbidites, which are high-energy submarine depositional environments encountered near continental shelf margins. The superior vertical resolution offered by HRI measurements can improve the evaluation of thin beds contained in turbidite sequences. Deep Invasion Typically, deeply invaded formations are associated with moderate permeability, medium to low porosity, high-water-loss muds, overbalanced mud systems, and drilling operations in pressure-depleted reservoirs. By investigating 1.4 times deeper than conventional induction devices, the HRI tool explores past the invaded zone to improve true resistivity measurement accuracy. |
 |
Nhóm Marketing
Electrical Micro-Imager
|
EMI – COST-EFFECTIVE TECHNOLOGY FOR FORMATION AND RESEVOIR EVALUATION |
 |
Tool specification
|
| In today’s economically-sensitive energy world, thorough and cost-effective reservoir evaluation is more important than ever before. Halliburton’s Electrical Micro Imaging (EMI™) service is a new process designed to meet these needs by producing core-like electrical micro-conductivity images of the formation sequence encountered in the wellbore.
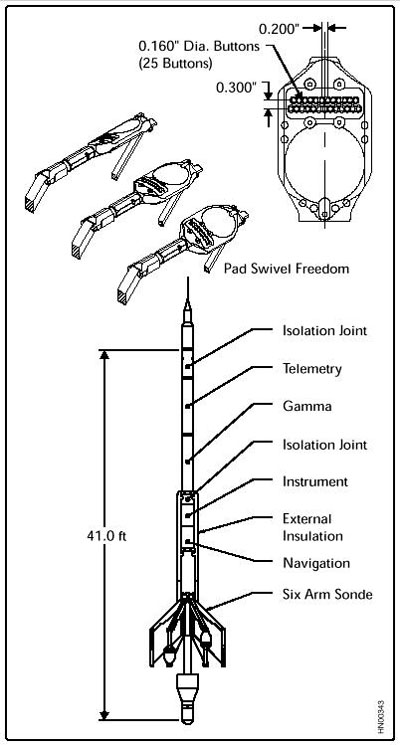
Based on the Award-Winning Six-Arm Dipmeter (SED ™) Technology. The mechanically proven architecture of the EMI is based on six articulating pads, each mounted on an independent arm, allowing improved electrode-to-formation contact. Quality formation images are achieved using 150 pad-mounted sensors distributed 25 on each of the six pads. This results in a measurement resolution of 0.2 inches. Conventional dipmeter information is recorded in addition to the image data. Operating Principles The EMI tool provides an image of the borehole wall by measuring and mapping formation micro-conductivity with the pad-mounted button electrodes. Current is emitted from the lower section of the tool into the formation. Part of this current (survey current) flows from the pad-mounted buttons, but the rest (focusing current) is used for focusing and maintaining high-resolution measurement. The current of each button is recorded as a curve, sampled at 0.1 inch (0.25 centimeters), or 120 samples per foot. The curves reflect the relative micro-conductivity variations within the formation. These current variations are converted to synthetic color or gray-scaled images. Light colors represent low micro-conductivity, while dark colors reflect high micro-conductivity zones. Centralization above and below the EMI mandrel optimizes the distribution of the six pads across the circumference of the borehole, especially in horizontal and highly deviated wells. A full navigation package, consisting of three orthogonal fluxgate accelerometers and three orthogonal magnetometers, is included in the EMI tool to provide accurate information on tool position, motion, direction, and orientation within the borehole. The enormous amount of data acquired while logging is transmitted digitally to the surface unit via Halliburton’s proven Digital Interactive Telemetry System (DITS). |
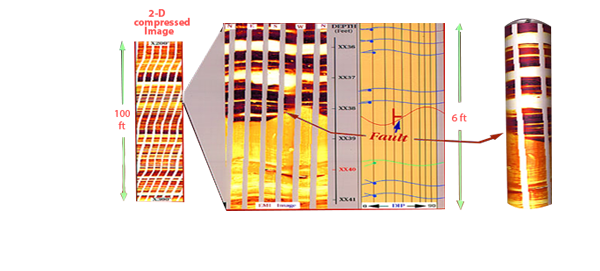
| IMAGING – THE KEY TO BETTER ANALISYS
Real-time images are produced at the wellsite. Detailed post-acquisition analysis of the image data is made with high-performance InterView ™ analysis software. Image analysis and enhancement techniques are available for precise identification of formation reservoir characteristics, including the following. |
|
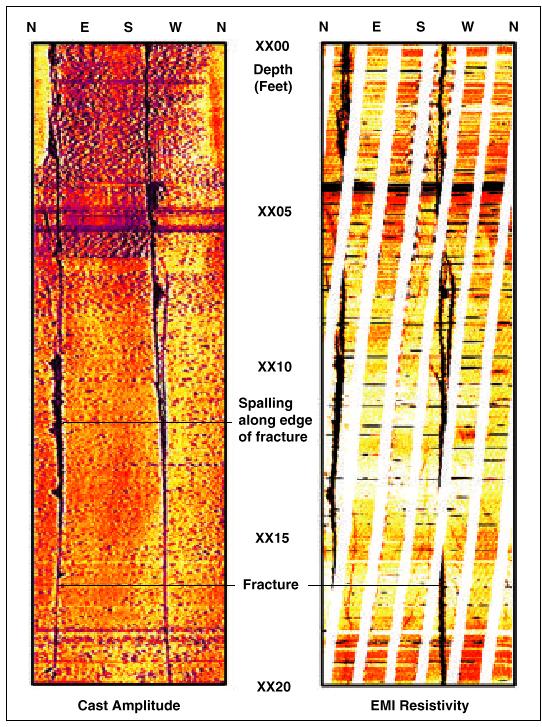 |
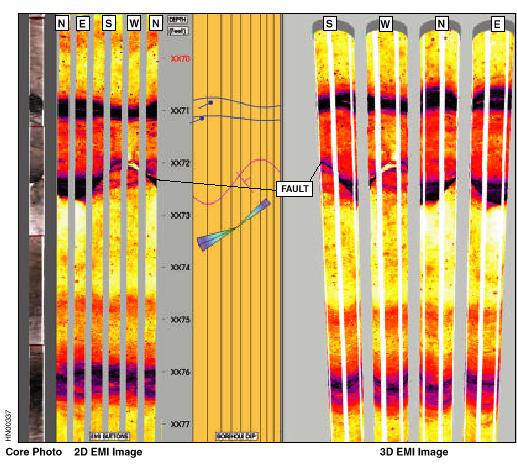
Comparison of EMI image and fullbore core, showing abrupt fault with no associated drag. |
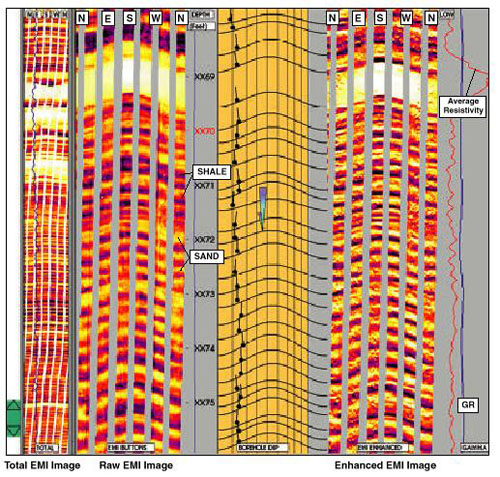 |
Thin bed response of the EMI tool in a laminated sand/shale sequence. |
Nhóm Marketing
Dipmeter
Tool specification
|
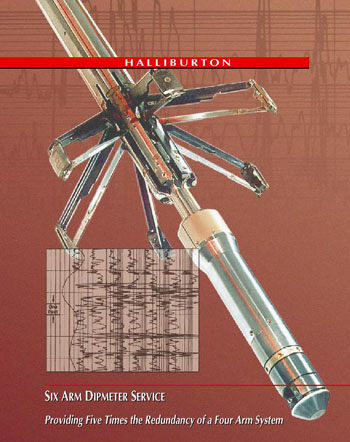 |
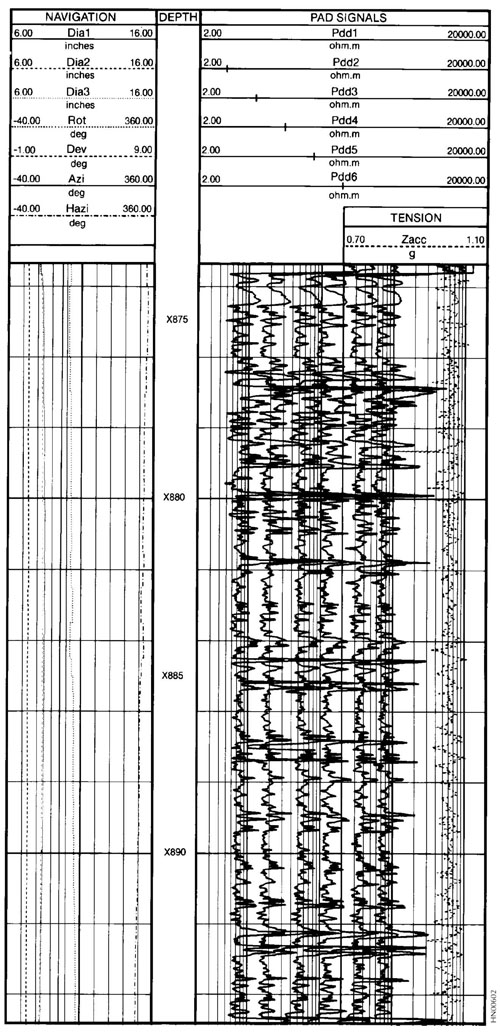
Six arm dipmeters employ six pad-mounted, focused current electrodes equally spaced about the main tool body. These electrodes measure resistivity at six azimuths about the borehole. These tools also measure borehole drift angle, drift azimuth, and borehole eccentricity. From this information software calculates the dip and strike of formations penetrated by the wellbore. The results are available in standard arrow, polar, and statistical plots and in tabular listings. These aid in identifying structural features such as regional dip, faults, reefs and unconformities. They also provide important information in determining depositional features such as cross bedding, foreset bedding and channel sand. Drift surveys, borehole profiles and fracture profiles are also produced from six-arm dipmeter measurements. With their six independently sprung caliper arms and their swiveled pads, Six-Arm Dipmeter achieve uniform contact |
| with the borehole wall. Thus, they are better able to accommodate borehole irregularities in both the circumferential and axial senses. Tool centralization is not a critical factor, even in deviated wells, and the effects of irregular tool motion are minimal.
Six-Arm Dipmeters can be run in any type of borehole liquid survey, even in oil-base muds. Application |
|
 |
Nhóm Marketing
WaveSonic Log
|
WAVE SONIC - Halliburton's Third Generation Ultra-Reliable, Crossed Dipole Sonic Tool THE BETTER KEY TO FRACTURE RESERVOIR EVALUATION |
 |
Tool specification
Halliburton's WaveSonic crossed dipole sonic tool makes it easy to determine fast and slow shear wave travel times and their orientation in the formation. With the WaveSonic, you can even calculate minimum and maximum principal stresses and stress field orientation by combining oriented slowness data with overburden and pore pressure data. This information is vital for mechanical analysis, wellbore stability and production enhancement treatment design. Sonic anisotropy and the orientation of the anisotropy can be used to determine the orientation of natural fractures. Sonic attributes such as P wave slowness, fast and slow shear wave travel time, identification of compressive fluids in the pore space, and anisotropy orientation allow for better 3 D seismic analysis. |
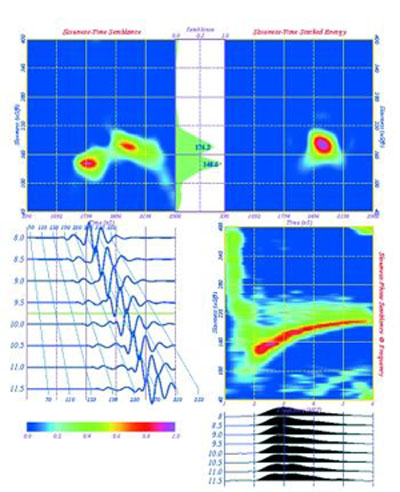 |
This is an example of a semblance diagnostic plot of the waveform data from the eight waveforms. In the circle is a section of a WaveSonic log showing Monopole P wave slowness and semblance quality monopole refracted Shear wave |
| The Product of Halliburton’s WaveSonic tool service provides simultaneous monopole and crossed dipole sonic information. P‑wave and S‑wave slowness can be obtained in formation conditions ranging from poorly consolidated high porosity gas saturated sandstones to low porosity carbonates. The flexural wave energy is propagated from a low frequency on‑depth crossed dipole bender‑bar source. The low frequency flexural wave travels at the true shear slowness of the formation. As a result, dispersion corrections for shear have slowness are not required. A low frequency monopole source is utilized, so the P‑wave and flexural wave data have similar depths of investigations well beyond any near wellbore alteration. Other benefits include:
- No need for dispersion corrections for slowness determination. ‑ No depth shifting of waveform data for anisotropy analysis.
|
Nhóm Marketing
FullWave Sonic Log
 |
The sonic logging system developed by Halliburton provides more acoustic information than ever before. From 1997, Vietsopetro L&TD successfully evaluated potential zones in fractured basement using FWST data.
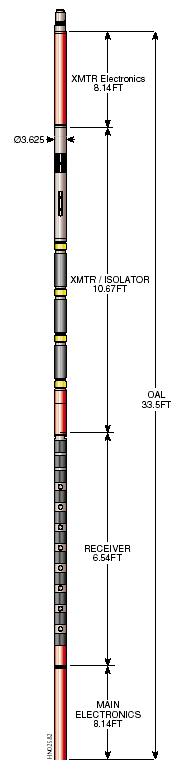
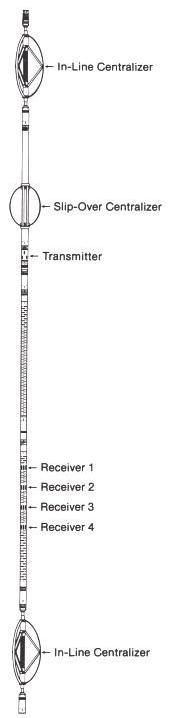
Using a piezoelectric transmitter and four long‑spaced receivers, the FWS system records the entire acoustic wavetrain. Digital processing techniques extract compressional, shear, and Stoneley t; shear wave and compressional wave amplitudes; and Stoneley wave attenuation. These basic measurements provide valuable information on rock types, gas zones, porosity naturally fractured intervals, formation elastic properties, stress field around the borehole, permeability, and acoustic impedance.
FWS APPLICATIONS
|
|
FWST – An effective tool to evaluate the potential zones in fractured basement.
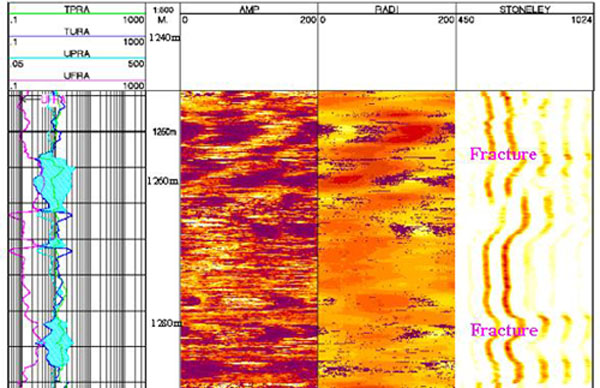
FWST has been used by Vietsopetro L&TD to investigate the characteristics of fractures in basement of Cuu Long basin. The tc, ts and tst and energy attenuation measurements have been used for: - Detection of naturally fractured zones. - Indication of permeability variations with depth from Stoneley wave attenuation. - Lithology identification by means of velocity ratio, ts /tc In fact, surveys in basement of Cuu Long basin indicated that FWST is an effective tool for evaluation of fracture zones in basement. |
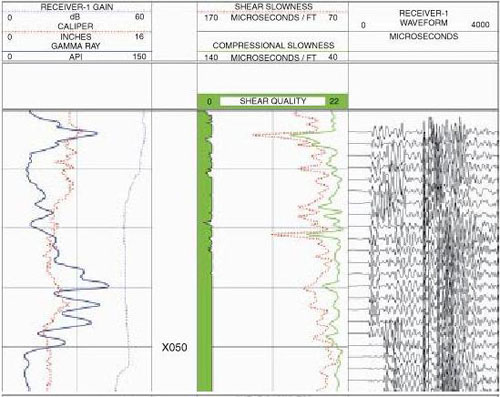 |
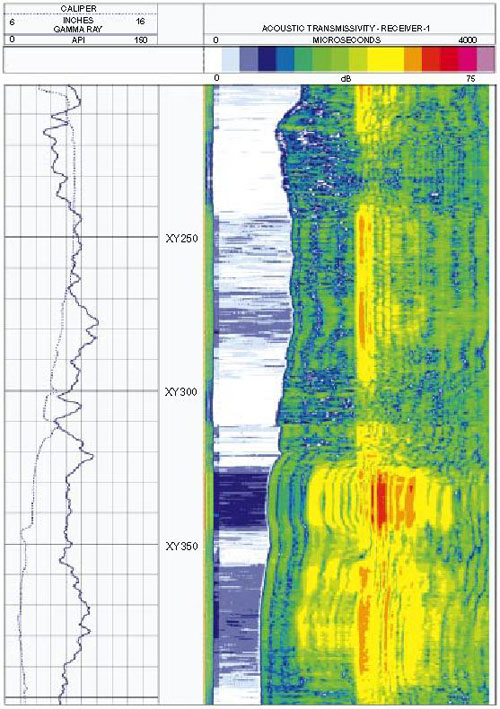
This FWS primary log example displays the raw waveform data from Receiver 1 in the right track. Processed results, including compressional and shear slowness curves (tc and ts), are shown in the center track, along with a shear slowness quality indicator Caliper and Gamma Ray information, along with a gain curve, are displayed in the left track |
 |
Instantaneous Waveform Characteristics IWC analysis allow users better evaluation of fracture zones as spectrum of amplitude, phase and frequency of waveform |
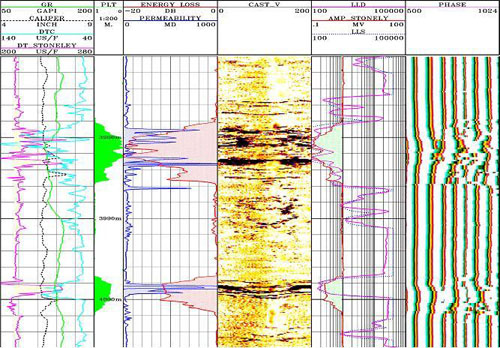 |
This plot shows potential zones in White Tiger fractured basement by mean of the energy loss of Stoneley wave (Track 5). In fact, these zones are highly productive. |
Nhóm Marketing
Borehole Compensated Sonic Log
|
|
Tool specification
Borehole Compensated Sonic tools determine the time required for a compressional sound wave to travel through one foot of formation. The travel time depends upon the formation's lithology, porosity, and type of pore fluid. Thus, if lithology and type of pore fluid are known, travel time can be related to porosity. As an aid to interpretation of seismic data, the compressional travel times are integrated and the results indicated on the log. A tick mark appears on the log for each millisecond of elapsed time. The interval between tick marks indicates the depth interval through which sonic waves travel in 1 millisecond. Compensated Sonic tools contain two acoustic transmitters and two acoustic receivers. The standard arrangement of these components results in travel time measurements made with transmitter-to-receiver spacing of 3 and 5 feet. The use of such multiple travel time measurements allows for compensation for borehole fluids, borehole rugosity, and tool tilt Compensated Sonic tools are run in liquid-filled wells and should be centralized in the borehole. The tools can be combined with other tools such as Gamma Ray, Induction, Laterolog, Density, Neutron, and Caliper. |

| |
Applications:
|
Nhóm Marketing
Dual Spaced Neutron Log
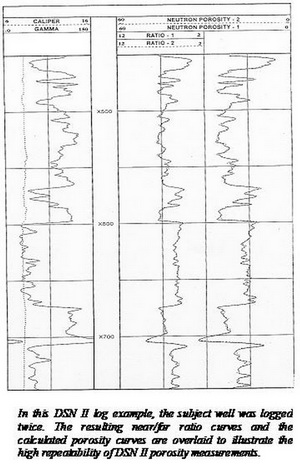
| Vietsovpetro L&TD uses Halliburton’s DSN II tools from 1997 for lithology & porosity identification for sedimentary and basement rock.
DSN II is a superior neutron porosity tool. This is due to detector array optimization. Far detector count rates are much greater than ever before. Other advantages stem from the ratio-porosity relationship. Detailed analysis shows that DSN II statistical uncertainty has been significantly reduced compared with previous top-performing tools, while the overall signal-to-noise ratio is notably better than before.
|
 |
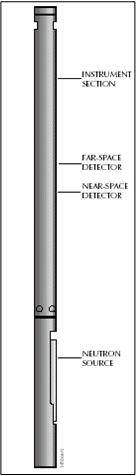 |
Tool specification |
 |
|
These features translate into porosity measurements with outstanding precision. DSN II delivers porosity measurements with greater accuracy and repeatability than any other neutron porosity service. Designed for use in liquid-filled holes, both open and cased, this service provides:
|
?Nhóm Marketing
viagra pas cher - buyfrviagra.com - problèmes sexuels liés peuvent commencer début dans un style de vie ou qu'ils pouvaient suite Offres passionnant et rapports . Problèmes construire que le temps passe , ou peut-être peut se produire soudainement immédiatement en ensemble manque de capacité et s'impliquer dans un certain nombre d' stades de la acte à caractère sexuel. Les causes de l' problèmes sexuels liés pourrait être corporelles , psychologique ou les deux . Émotionnel facteurs qui influent sur le sexe culturels interne problèmes de santé mentale au sein de l' à l'intérieur du personne uniques. Interpersonnelles troubles complications comprennent matrimonial ainsi que questions ou pas assez avec parmi concernant partenaires. Personnalisé particulières problèmes psychologiques incorporer , sexe craintes ou culpabilité ou précédente blessure . Eventhough it peut paraître maladroit de parler avec votre médecin sur dysfonction érectile , {vont dans des | Ñ | chercher | choisir | get {} une évaluation | une évaluation}. Questions ou essayant de garder peut être un warning de état de santé qui a vraiment besoin traitement , y compris maladie cardio-vasculaire ou terriblement contrôlé diabétique. Traiter un sous-jacent pourrait être pour aider à inverser votre problèmes érectiles .
viagra france - buyfrviagra.com - problèmes sexuels liés peuvent commencer début dans un style de vie ou qu'ils pouvaient suite Offres passionnant et rapports . Problèmes construire que le temps passe , ou peut-être peut se produire soudainement immédiatement en ensemble manque de capacité et s'impliquer dans un certain nombre d' stades de la acte à caractère sexuel. Les causes de l' problèmes sexuels liés pourrait être corporelles , psychologique ou les deux . Émotionnel facteurs qui influent sur le sexe culturels interne problèmes de santé mentale au sein de l' à l'intérieur du personne uniques. Interpersonnelles troubles complications comprennent matrimonial ainsi que questions ou pas assez avec parmi concernant partenaires. Personnalisé particulières problèmes psychologiques incorporer , sexe craintes ou culpabilité ou précédente blessure . Eventhough it peut paraître maladroit de parler avec votre médecin sur dysfonction érectile , {vont dans des | Ñ | chercher | choisir | get {} une évaluation | une évaluation}. Questions ou essayant de garder peut être un warning de état de santé qui a vraiment besoin traitement , y compris maladie cardio-vasculaire ou terriblement contrôlé diabétique. Traiter un sous-jacent pourrait être pour aider à inverser votre problèmes érectiles .
viagra wiki - buyfrviagra.com- problèmes sexuels liés peuvent commencer début dans un style de vie ou qu'ils pouvaient suite Offres passionnant et rapports . Problèmes construire que le temps passe , ou peut-être peut se produire soudainement immédiatement en ensemble manque de capacité et s'impliquer dans un certain nombre d' stades de la acte à caractère sexuel. Les causes de l' problèmes sexuels liés pourrait être corporelles , psychologique ou les deux . Émotionnel facteurs qui influent sur le sexe culturels interne problèmes de santé mentale au sein de l' à l'intérieur du personne uniques. Interpersonnelles troubles complications comprennent matrimonial ainsi que questions ou pas assez avec parmi concernant partenaires. Personnalisé particulières problèmes psychologiques incorporer , sexe craintes ou culpabilité ou précédente blessure . Eventhough it peut paraître maladroit de parler avec votre médecin sur dysfonction érectile , {vont dans des | Ñ | chercher | choisir | get {} une évaluation | une évaluation}. Questions ou essayant de garder peut être un warning de état de santé qui a vraiment besoin traitement , y compris maladie cardio-vasculaire ou terriblement contrôlé diabétique. Traiter un sous-jacent pourrait être pour aider à inverser votre problèmes érectiles .
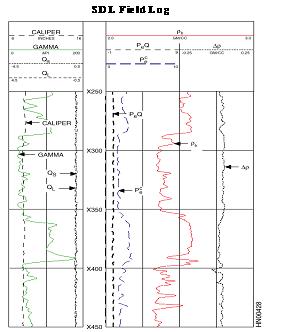
Spectral Density Log
| In order to use the latest techniques in wireline logging and for more accurate lithology & porosity identification for sedimentary and basement rock, from 1997 Vietsovpetro L&TD has been using Halliburton’s Spectral Density Log Tools (SDL-T).
Spectral Density Log provides superior formation bulk density (rb) and borehole Compensated photoelectric factor (Pe) measurements. These measurements are key factors for
|
|
Compensated Spectral Natural Gamma Ray
|
 |
| In order to use the latest technique of wireline logging and for more accurate lithology analysis of sedimentary and basement rock from 1997, Vietsovpetro L&TD has been using Halliburton’s CSNG™.
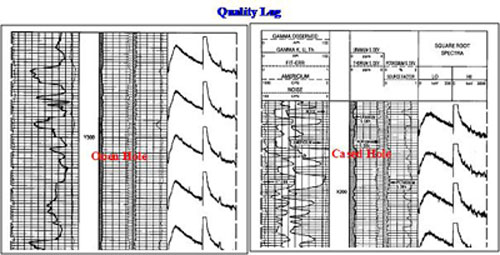
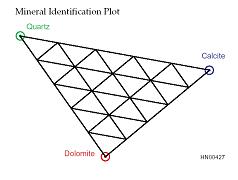
CSNG™ provides highly accurate measurements of potassium, uranium, and thorium by detecting the gamma rays they emit. The concentrations of these elements reveal petrological information to help ensure clean rock is not mistaken for shale or clay. For example: with a standard gamma ray log, high gamma ray counts are frequently interpreted as shale. In the same environment, the CSNG could correctly attribute high gamma ray counts to the presence of uranium or potassium and correctly identify the rock as a potential reservoir. |
|
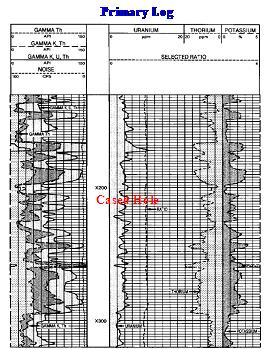
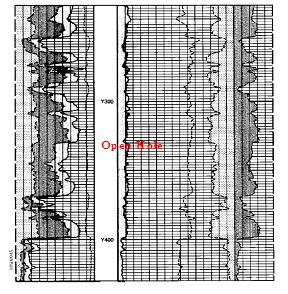
The CSNG measures the entire gamma spectrum, from 0 to 3000 keV, in both open and cased holes, producing both a primary and a quality log in real-time.
|
 |
 |
|
Nhóm Marketing |