L&TD
LOGGING & TESTING DIVISION
Sản phẩm dịch vụ
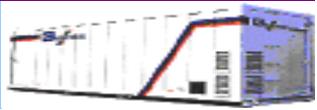
Mud Logging Unit ALS-2
| II. UNIT ALS-2 MUD LOGGING:
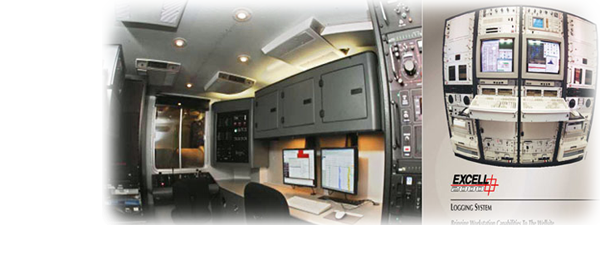
1. Introduction: The ALS-2 Mud Logging Unit provides highly automated monitoring of the entire drilling operation. More than 70 parameters can be measured, processed, displayed, printed and recorded simultaneously. The acquisition system also calibrates the received signals and checks the state of the sensors for electrical faults such as a cut cable or open circuit. In the case of malfunction, an alarm is activated immediately alerting the operator. For data processing a totally new concept has been adopted based entirely on computer technology. The sensor signals are transformed into digital format and then distributed according to requirement. The data is supplied on screen monitors (two types of screen system exist, the “Alpha-numeric” and the “Graphic”) or intelligent interfaces in real-time or playback mode. Alarms can be placed on each parameter. Computerized printouts of desired parameters produce graphic charts of the progress of the well being drilled. In addition the database is continually recorded on magnetic storage support. The ALS is a powerful tool that may be placed in the hands of those with responsibility for the drilling rig. Using many forms of data presentation in the logging unit, monitors or intelligent interfaces can be placed anywhere on the rig. These terminals are “operator friendly” and enable anybody who needs information to have it right there in front of him in real-time or replay mode, and to apply analysis programs if necessary.
Off-line processing: An offline workstation is part of the ALS-2. This workstation has the following main functions:
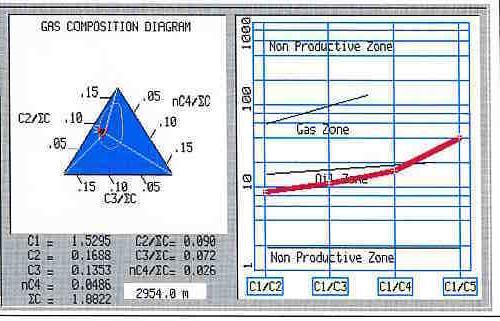
- Overpressure - Hydraulics (Bingham, Power Law and other models) - Deviation survey analysis - Surge & Swab - Drilling bit optimization - Bit performance and cost - Kick control - Gas ratio analysis + plots
|
 |
 |
| 2. Mudlogging equipment and services:
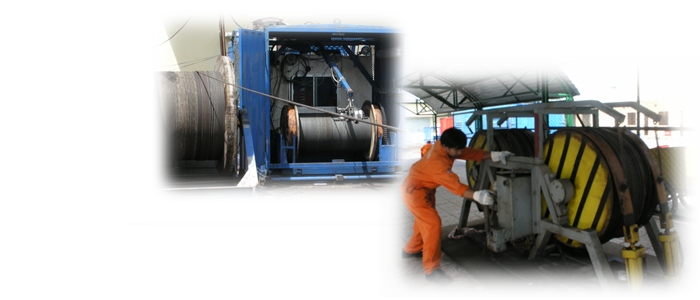
2.1 Mudlogging Unit: Mudllogging unit for offshore operation, complete with:
|
 |
2.2 Formation evaluation equipment:
|
 |
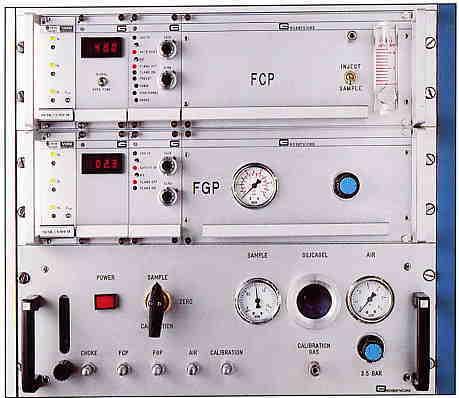
| 2.3 Gas detection system:
The FID (Flame Ionization Detector) Gas Detector & Chromatograph is a well site gas detection and analysis system. It continuously analyses gases extracted from the degasser.
|
 |
2.4 Sensors and parameters: Continuous analog recording on colour recorders and digital display on colour monitor of:
 |
| 2.5 Computer equipment
Computer equipment consisting:
|
 |
 |
2.6 Reporting:
 |
Nhóm Marketing
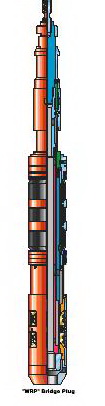
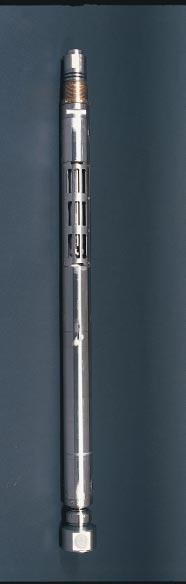
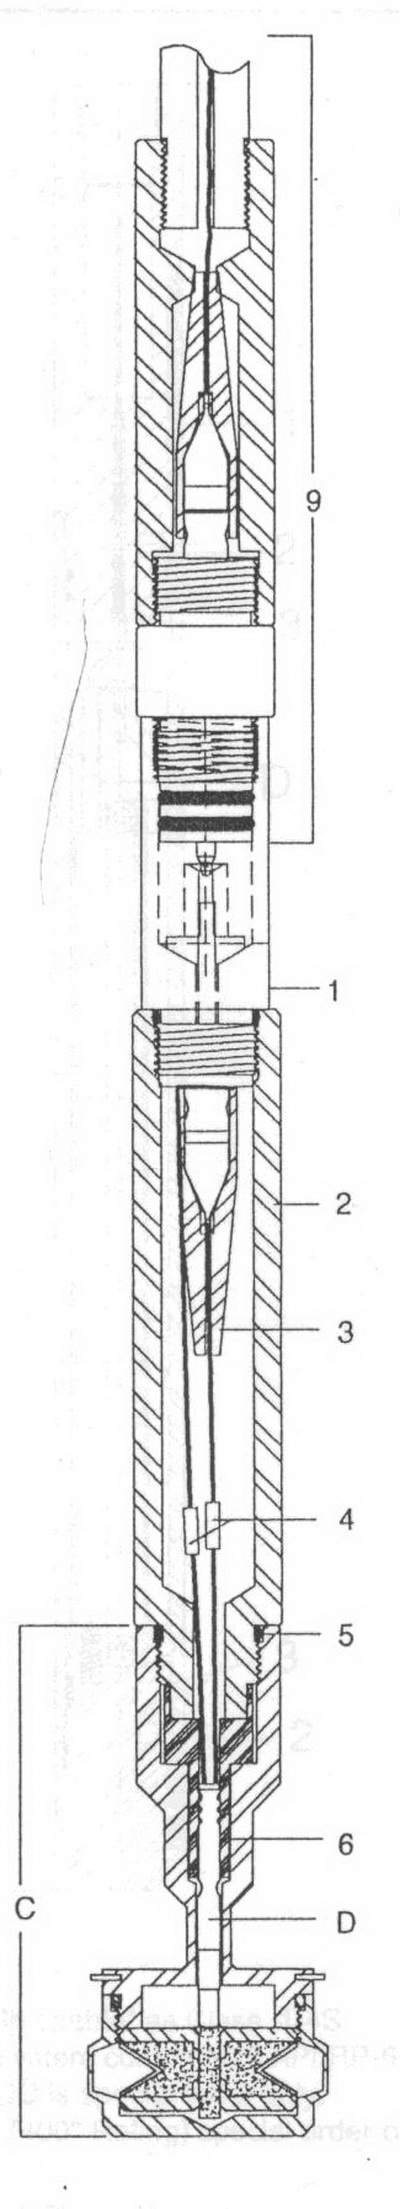
Bridge plug and packer setting
The Weatherford WRP is a wireline set, packer type, retrievable bridge plug capable of holding differential pressure from above or below. Utilizes standard wireline or hydraulic setting tools. Used as a temporary bridge plug for acidzing, fracturing, cementing, casing pressure tests, wellhead replacement and zone isolation.
|
 |
||||||||||||||||||||||||||||||||||||||||||||||||||||||||||||||||||
Nhóm Marketing
MITPro SOFTWARE
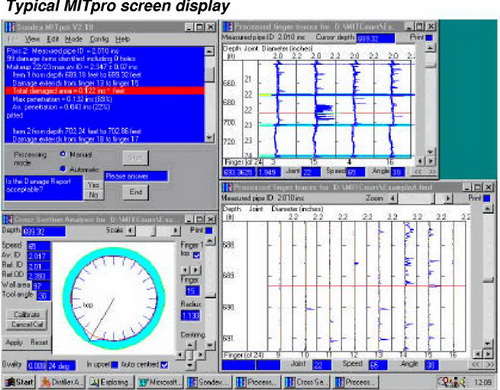 |
DESCRIPTION The Data Processing Software for the Sondex Multi-Finger Imaging Tool (MITpro software) performs the task of processing MIT raw data automatically, but under interactive user control. It reduces the tedium of manually analysing the data, producing consistent, reliable reports showing where and to what degree the pipe wall is damaged or scaled. The software locates |
|
collars in tubing or casing, using a range of specialised, automatic search algorithms. The results can be modified interactively, until a suitable description of every joint is obtained. To process the data, the software uses algorithms, which correct for tool decentring and fit the interior shape of the pipe locally. All deviations from the fitted shape are merged and classified into damage reports. The software configuration can be adapted to process the data from any type of survey, using any Sondex MIT tool. MITpro can generate highly reliable and consistent survey reports, which are stored as |
|
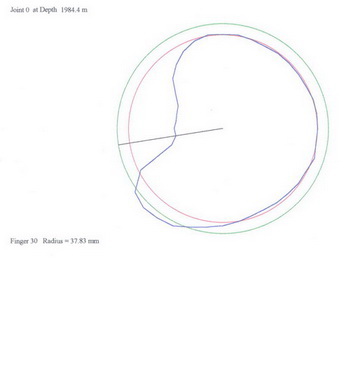
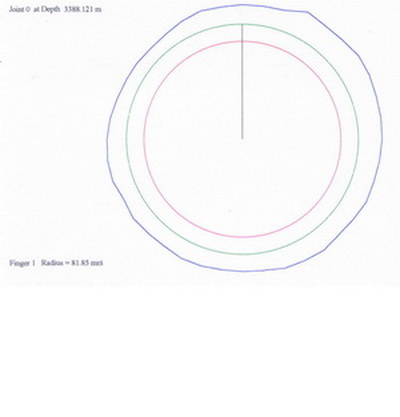
ASCII format disc files. These include Summary Report Files, which summarise the findings as a Joint Tabulation, and Process Report Files, which contain detailed damage information. The Summary Report can be printed out, to a high presentation standard, suitable for offering to end-users directly. Worst-case cross section plots can be generated and appended to the report automatically. Both metric and imperial formats are supported throughout. The MITpro software is a 32-bit application, which runs under Microsoft Windows 95 or Windows 98. The software can also run under Windows NT.
|
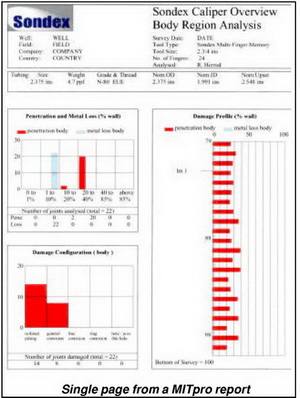 |
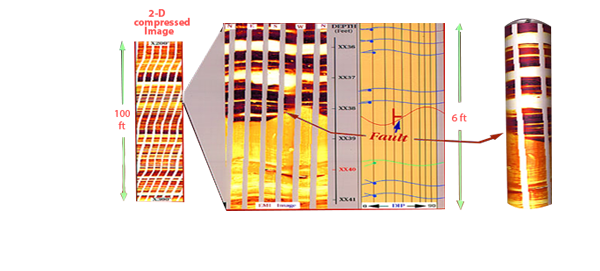
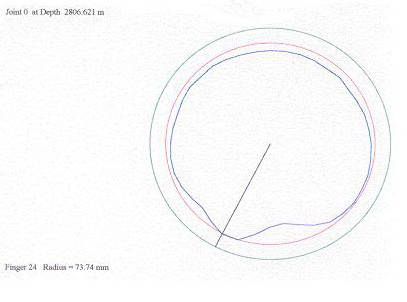
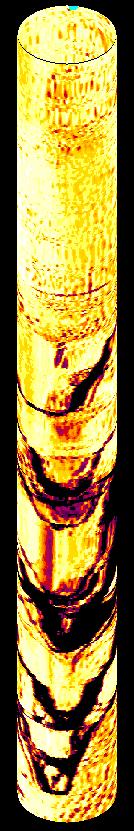
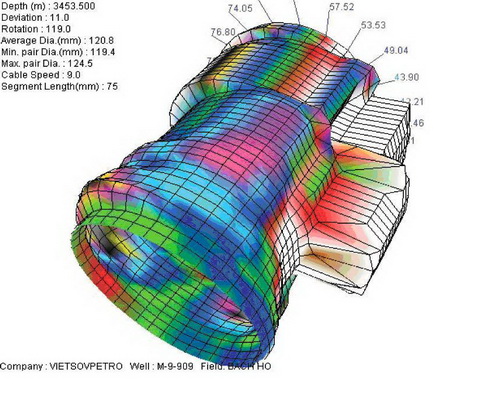
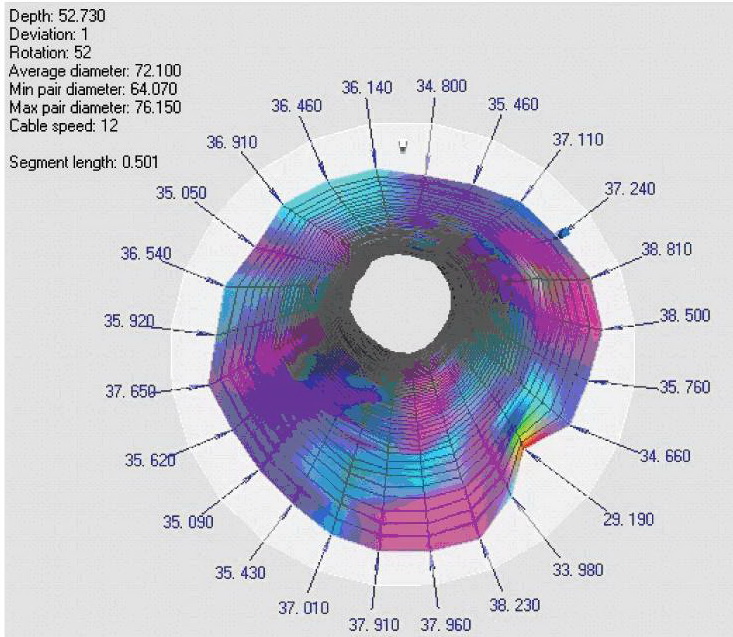
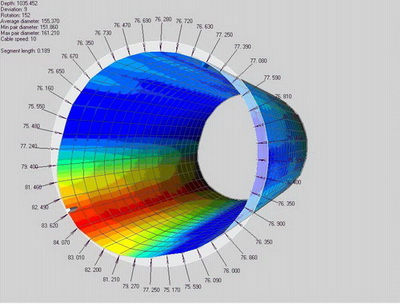
| Cross-sections produced by MITPro are very important to know the real status of the pipe in the well. MITPro has therefore been widely used in casing and tubing inspections in L & TD – VSP. These cross-sections combine with plots, produced by WellCAD and MITView software and are the most effective ways of showing pipe status.
Some pictures below were taken from the casing and tubing inspection results. Data source was recorded by MIT (24,40,60) tools in White Tiger oil field. |
 |
|
|
 |
 |
|
Nhóm Marketing
Toolpusher Assemblies
 |
Nhóm Marketing
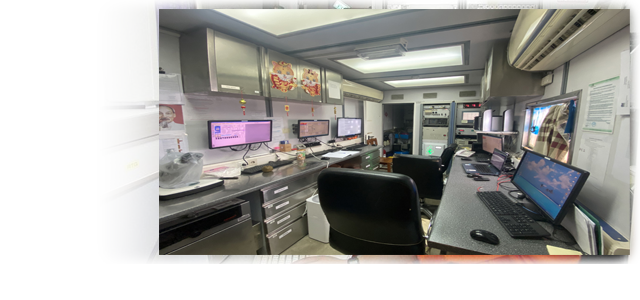
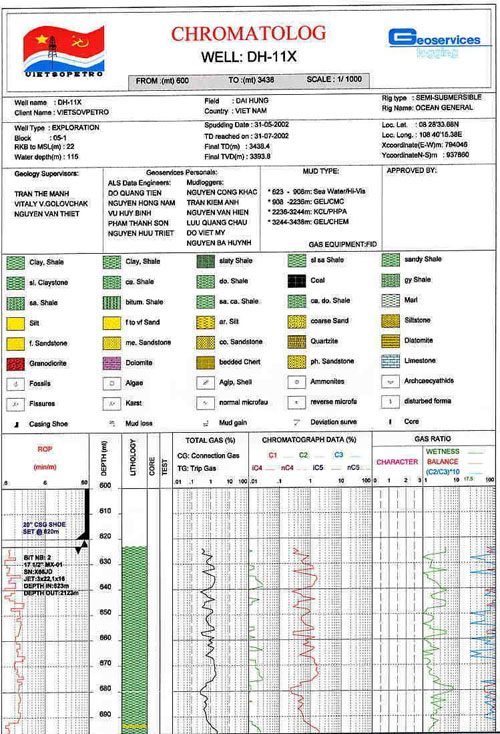
Mud Logging
1. Introduction
The Mud Logging Team of Logging & Testing Division is an operation unit with function to carry out mud logging services in almost wells of VSP. We have also performed mud logging services for some companies such as PIDC, PVEP, VRJ with many exploitation and exploratory wells. The Mud logging services are performed in either drilling process or workover operations with the possibility to fullfil following functions: to monitor and control drilling operations, to collect geological data, to increase drilling safety.
High Resolution Induction
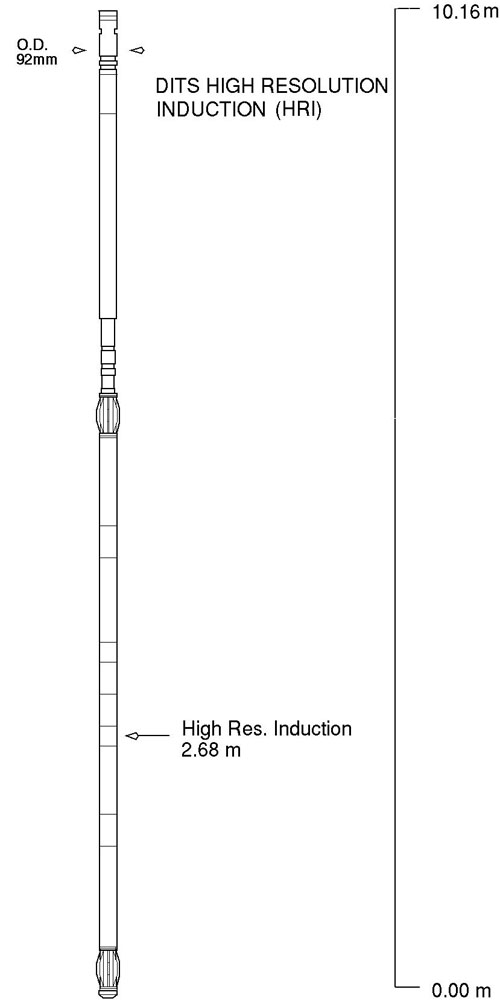 |
HRI Tool specification
|
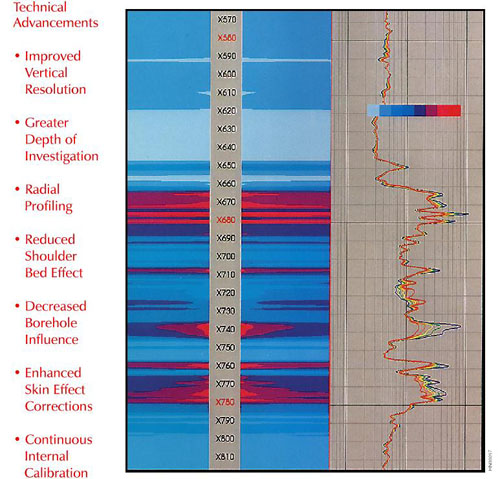
| As the search for new oil and gas resources continues, more and more exploration and development is targeted toward so-called unconventional reservoirs. Drilling objectives include interceded sand-shale sequences, thin beds, low-resistivity pay sands, and beds with little resistivity contrast from their surroundings. While the detection and evaluation of many of these reservoirs often exceed the capabilities of conventional resistivity devices, significant technical advancements allow HRI tools to locate and provide accurate information about such zones, which may otherwise be bypassed
Thin beds Reservoir intervals less than 10 feet thick comprise numerous primary and secondary exploration and development objectives. Utilizing reduced shoulder bed effects and improvements in vertical response, HRI logs resolve beds as thin as 2 feet. Laminated Sand-Shale Sequences Marine depositional environments and fluvial flood plains commonly contain laminated sand-shale sequences. Decreased shoulder response and improved vertical resolution again enhance interpretation in these situatio |
| Additional Secondary Objectives
By detecting thin beds and using quadrature processing to improve tool response, HRI logs can locate additional, potentially productive zones not indicated by other logging devices. While some primary objectives may not require HRI advantages for evaluation, HRI logs can illuminate secondary production possibilities for completion attempts. Without HRI information, numerous profitable secondary objectives could be permanently overlooked. Groningen-Effect Environments Below massive, highly resistive formations, deep laterolog devices read abnormally high resistivities. This phenomenon is known as the Groningen-effect and normally masks any productive zone below the massive resistive bed. HRI logs display no Groningen-effects. Oil-Base Muds Focused resistivity devices such as laterolog, spherically focused, and microspherically focused tools are designed to operate in an electrically conductive borehole medium and thus do not function effectively in oil-base muds. This requirement is not applicable to HRI tools; consequently, they are able to operate in oil-base muds and air-filled boreholes. Turbidites Deeper water exploration targets and many land prospects commonly include turbidites, which are high-energy submarine depositional environments encountered near continental shelf margins. The superior vertical resolution offered by HRI measurements can improve the evaluation of thin beds contained in turbidite sequences. Deep Invasion Typically, deeply invaded formations are associated with moderate permeability, medium to low porosity, high-water-loss muds, overbalanced mud systems, and drilling operations in pressure-depleted reservoirs. By investigating 1.4 times deeper than conventional induction devices, the HRI tool explores past the invaded zone to improve true resistivity measurement accuracy. |
 |
Nhóm Marketing
Casing Inspection CAST-V
| The newest generation Circumferential Acoustic Scanning tool, the CAST-V made by Halliburton, provides a wealth of information in both open and cased holes. In cased holes, ultrasonic pipe inspection and cement evaluation can now be obtained simultaneously. In open holes, the CAST-V provides complete borehole imaging for accurate formation evaluation.
Operating over a wide range of downhole environments, the CAST-V data can be presented in a variety of two- and three- dimensional formats. Powerful, yet user-friendly imaging analysis software is available to process the images, histograms and curve-type data. |
 |
Specifications
|
 |
|
Primary applications include:
|
| CAST-V – A COST-EFFECTIVE TOOL
FOR CASING INSPECTION AND CEMENT EVALUATION. CAST-V has been used by Vietsovpetro L&TD for casing inspection and cement evaluation. Cased hole diagnostic applications provide the following information: - Detailed radial caliper information, precise perforation location, - Casing damage inspection, corrosion effects description, real pipe wear identification. - Evaluation of complex and lightweight cement |
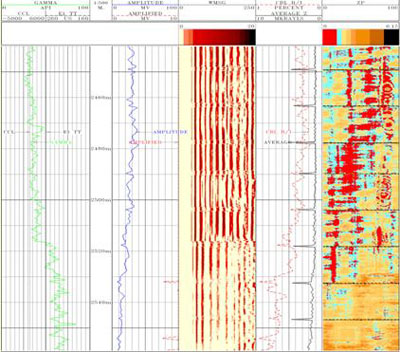 |
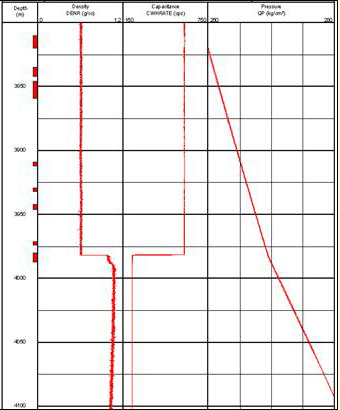
This plot of casedhole logs displays VDL in Track 3 and Impedance map in Track 5. They clearly indicate that interval 2440-2532 m, cement bonding is poor, the lower shows good bonding. |
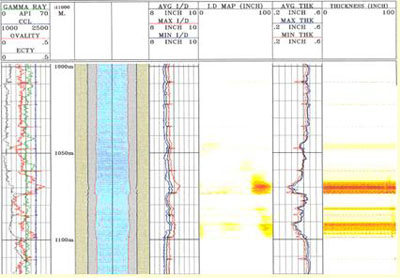 |
This plot of casedhole logs displays I.D map in Track 4 and Thickness map in Track 6. They clearly indicate corrosions in interval 1060-1100m |
Nhóm Marketing
Downhole Pressure Measurement
 |
DESCRIPTION
For high precision downhole pressure measurement, we use Sondex quartz pressure gauge tool, employing an industry standard quartz crystal pressure transducer. The tool provides both pressure and gauge temperature outputs.
OPERATING PRINCIPLE
Fluid pressure applied to the quartz tension member changes the resonant frequency of the quartz crystal. Thermal compensation of the sensor and measurement of its temperature allows the calculation of very accurate, high-resolution downhole pressures. Pressure readings are digitized to 24-bit resolution and gauge temperature to 16 bits and transmitted on one channel of the telemetry system simultaneously with other logging signals. In surface readout applications two pressure tools can be used with output from both tools transmitted in a single digital channel.
SPECIFICATIONS
|
|
Benefits:
|
 |
 |
The study of hydrodynamic characteristics is one of the most important methods to monitor production life of reservoir. It consists of:
|
Nhóm Marketing
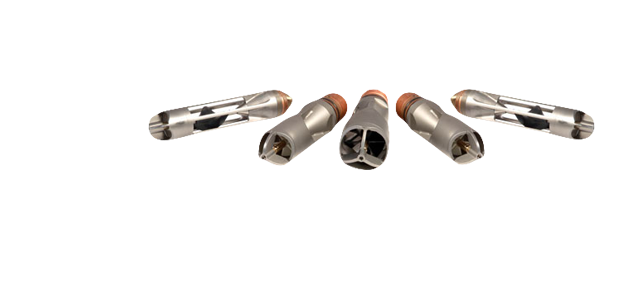
Super Tubing Cutters
|
· Benefits & Features - Tubing cutter is always shot between two collars. Operatinally very simple - Cutting by tubing cutter will not damage casing
|
 |
|
|||||||||||||||||||||||||||||||||||||||||||||||||||
Nhóm Marketing
MITView SOFTWARE
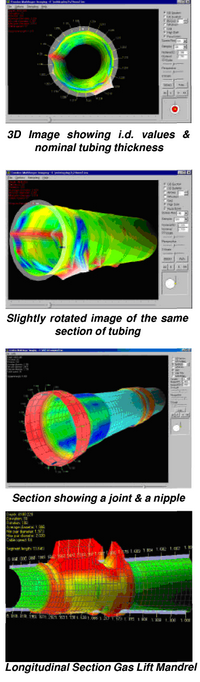 |
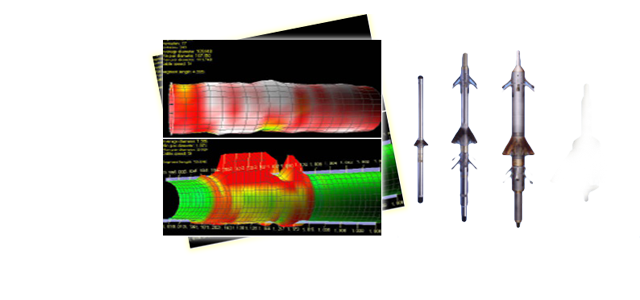
DESCRIPTION One of the most effective ways of understanding the condition of a well is to produce 3D images. To achieve this, we use a package called MITview
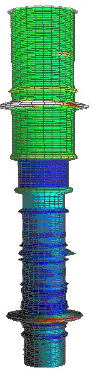 s of a particular job together with an operating version of the program. This allows the engineer responsible for the well to run MITView and examine the data himself s of a particular job together with an operating version of the program. This allows the engineer responsible for the well to run MITView and examine the data himselfExported images can be used to produce hard copy pictures suitable for use in written reports, for example the BOP shown on the right. |
| Some pictures below illustrate this software application in Vietsovpetro L&TD. Data was recorded by MIT (24,40,60) tools in White Tiger oil field. |
 |
|
|
 |
 |
|
Nhóm Marketing
Vsprowess Software
|
Main Features • Three component processing of any survey configuration • Image reconstruction of P and S wave modes, both CDP mapping and migration, using simple dip, anisotropic models. • Time slice display of 3D datasets • Proximity surveys including anisotropy and simple dip • Q estimation • Wavelet extraction/matching • AVO/ • Fracture monitoring display • Flexible display options • Input data formats include SEGY, • Velocity log calibration and synthetic seismogram • Import and display of LAS logs. 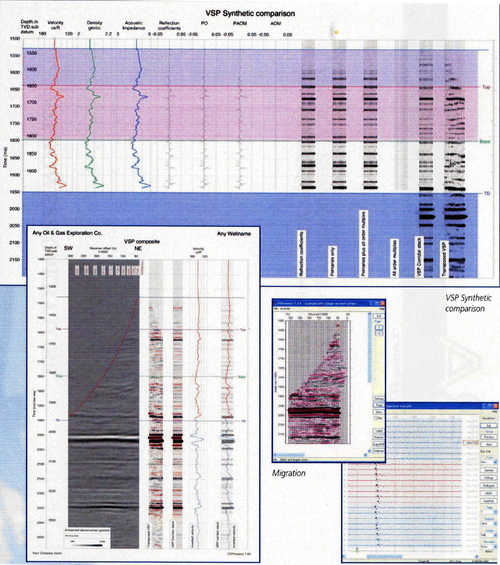 |
Nhóm Marketing